Conversations report
The conversations report in Hiver in Gmail gives you a clear view of your team’s workload. You can track how many conversations are Active, New, or Resolved during a selected period, and monitor performance through metrics such as:
- First response time: The time taken to send the first reply.
- First assign time: The time taken to assign a conversation to a teammate.
- Response time: The average time to reply to ongoing conversations.
- Resolution time: The total time a conversation remains open before it’s closed.
- Replies to resolution: The average number of replies sent before a conversation is resolved.
- First contact resolution: The share of resolved conversations closed with a single reply.
Use this report to identify workload patterns, spot delays, and ensure consistent, timely responses across your Shared Inboxes.
Get started with conversation reports
To access the conversations report, go to Analytics → Reports → select your Shared Inboxes → Conversations.
All metrics are calculated based on the selected date range. You can adjust the date range or switch to Business Hours, if needed.
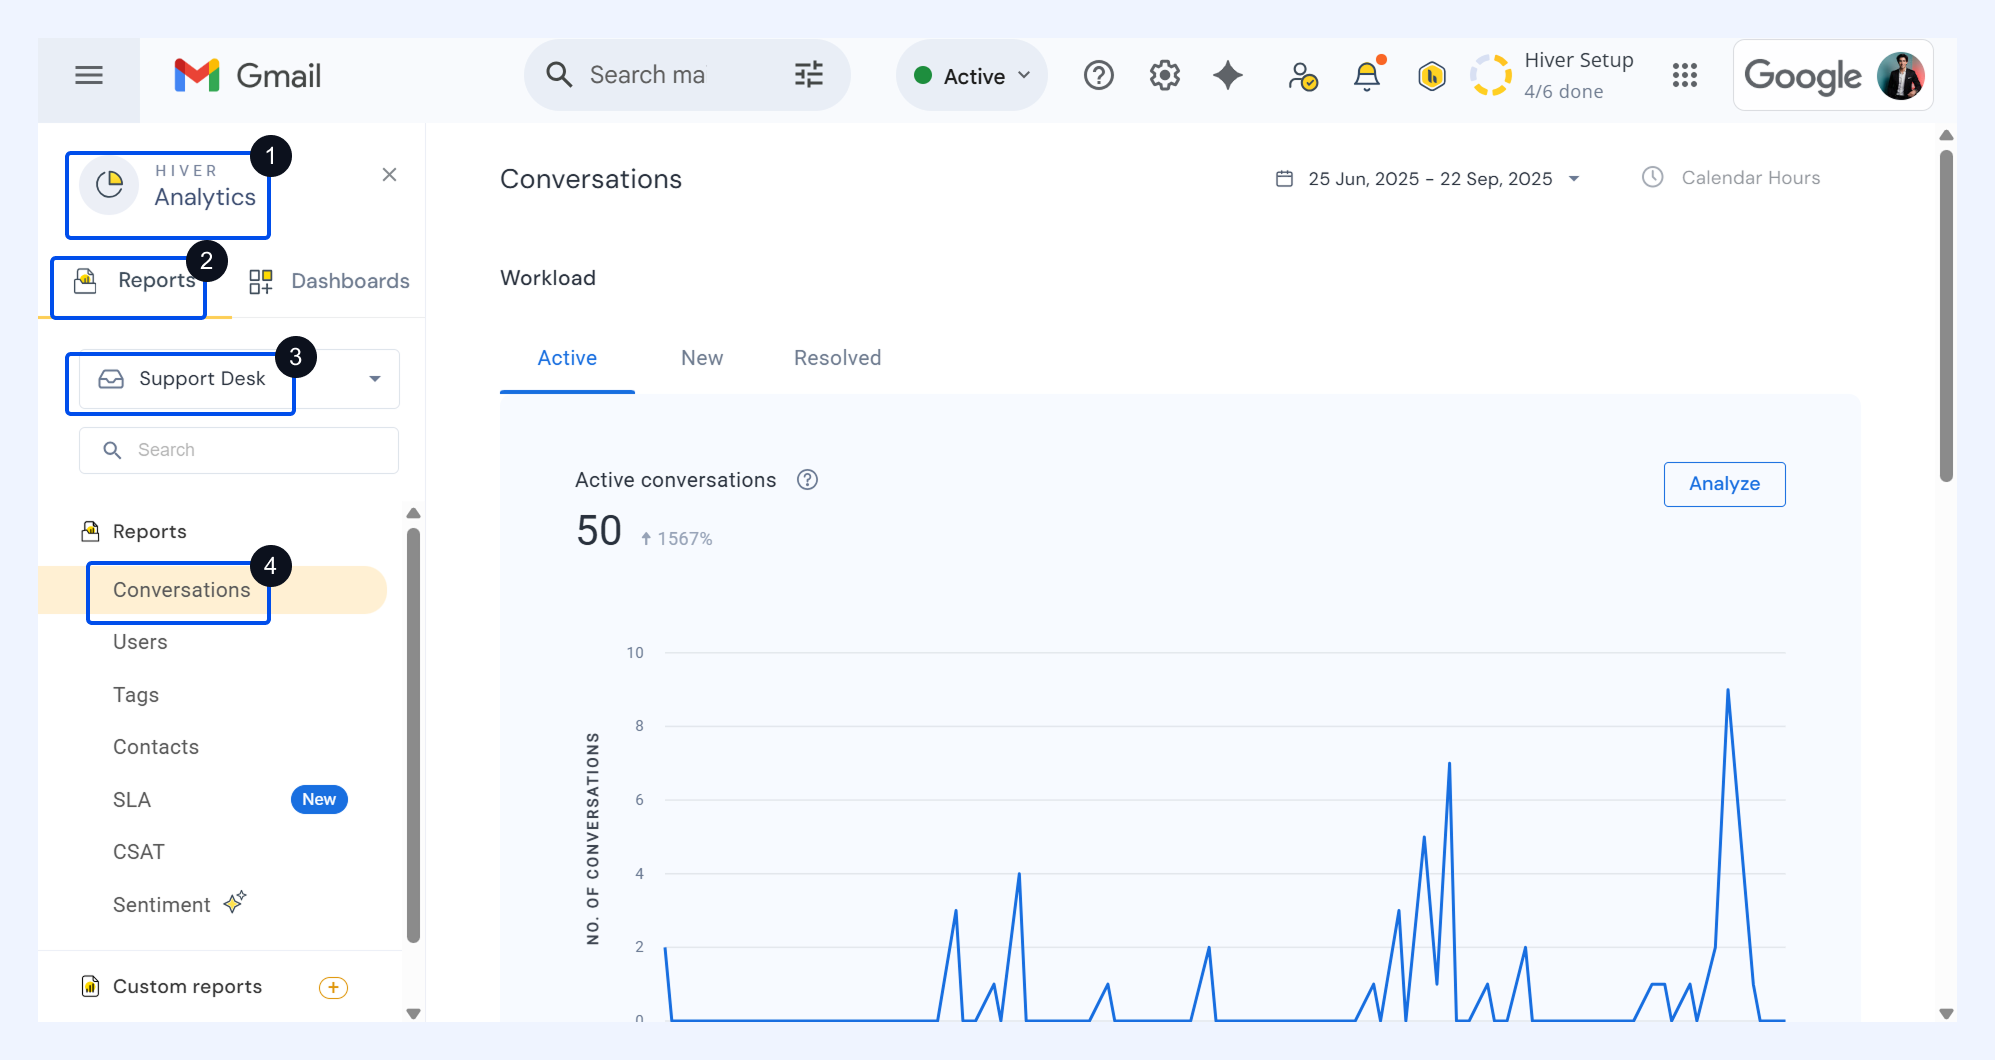
Workload metrics
Workload metrics show how many conversations your team is handling across different stages — active, new, and resolved. Together, these metrics give you a clear view of your team's workload and how efficiently conversations are being managed.
Active conversations
A conversation is marked as active when at least one email is sent or received during the reporting period.
If you’ve added a conversation to a shared inbox using Add to Shared Inbox, only the emails exchanged after it was added count toward the report.
Explore the report
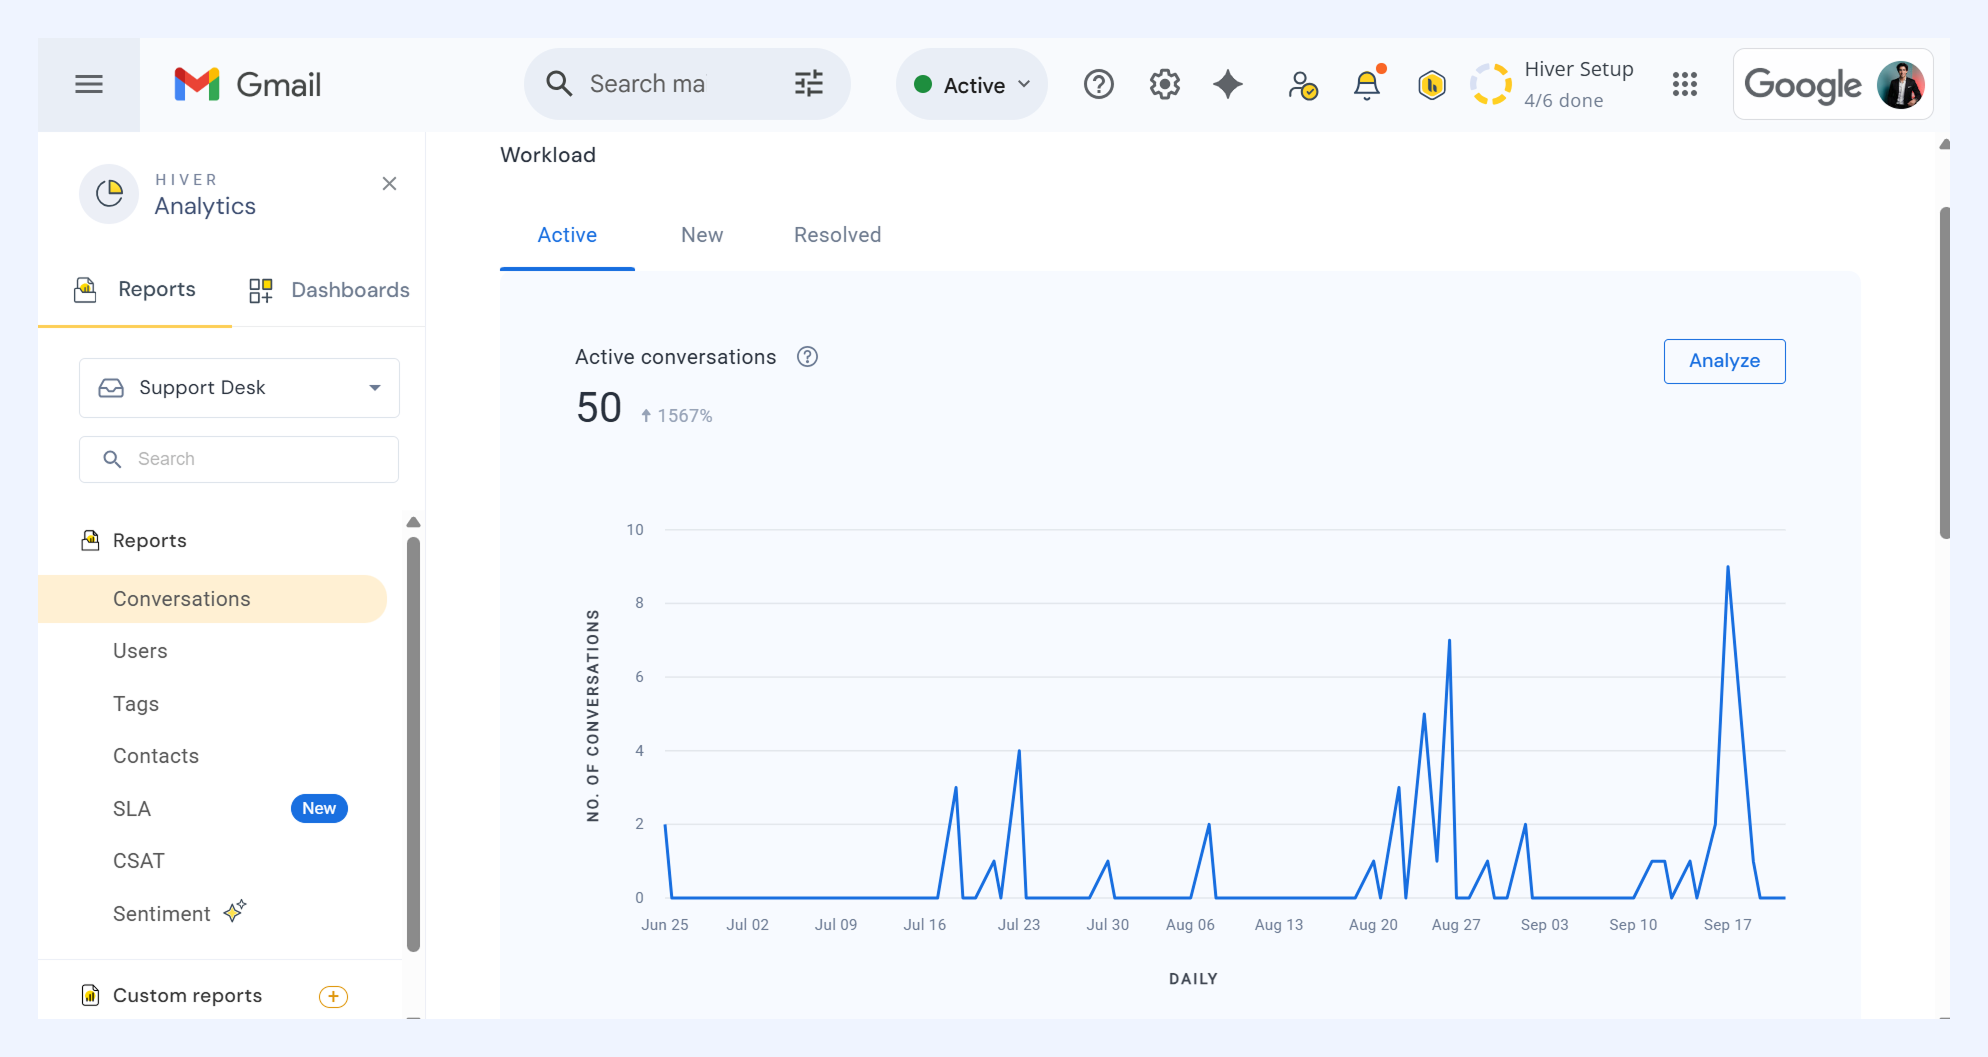
The report’s overview includes:
- A daily trend chart showing the number of active conversations each day.
- The total count of active conversations for the selected period.
- A percentage change comparing the count to the previous period of equal length.
Drill down
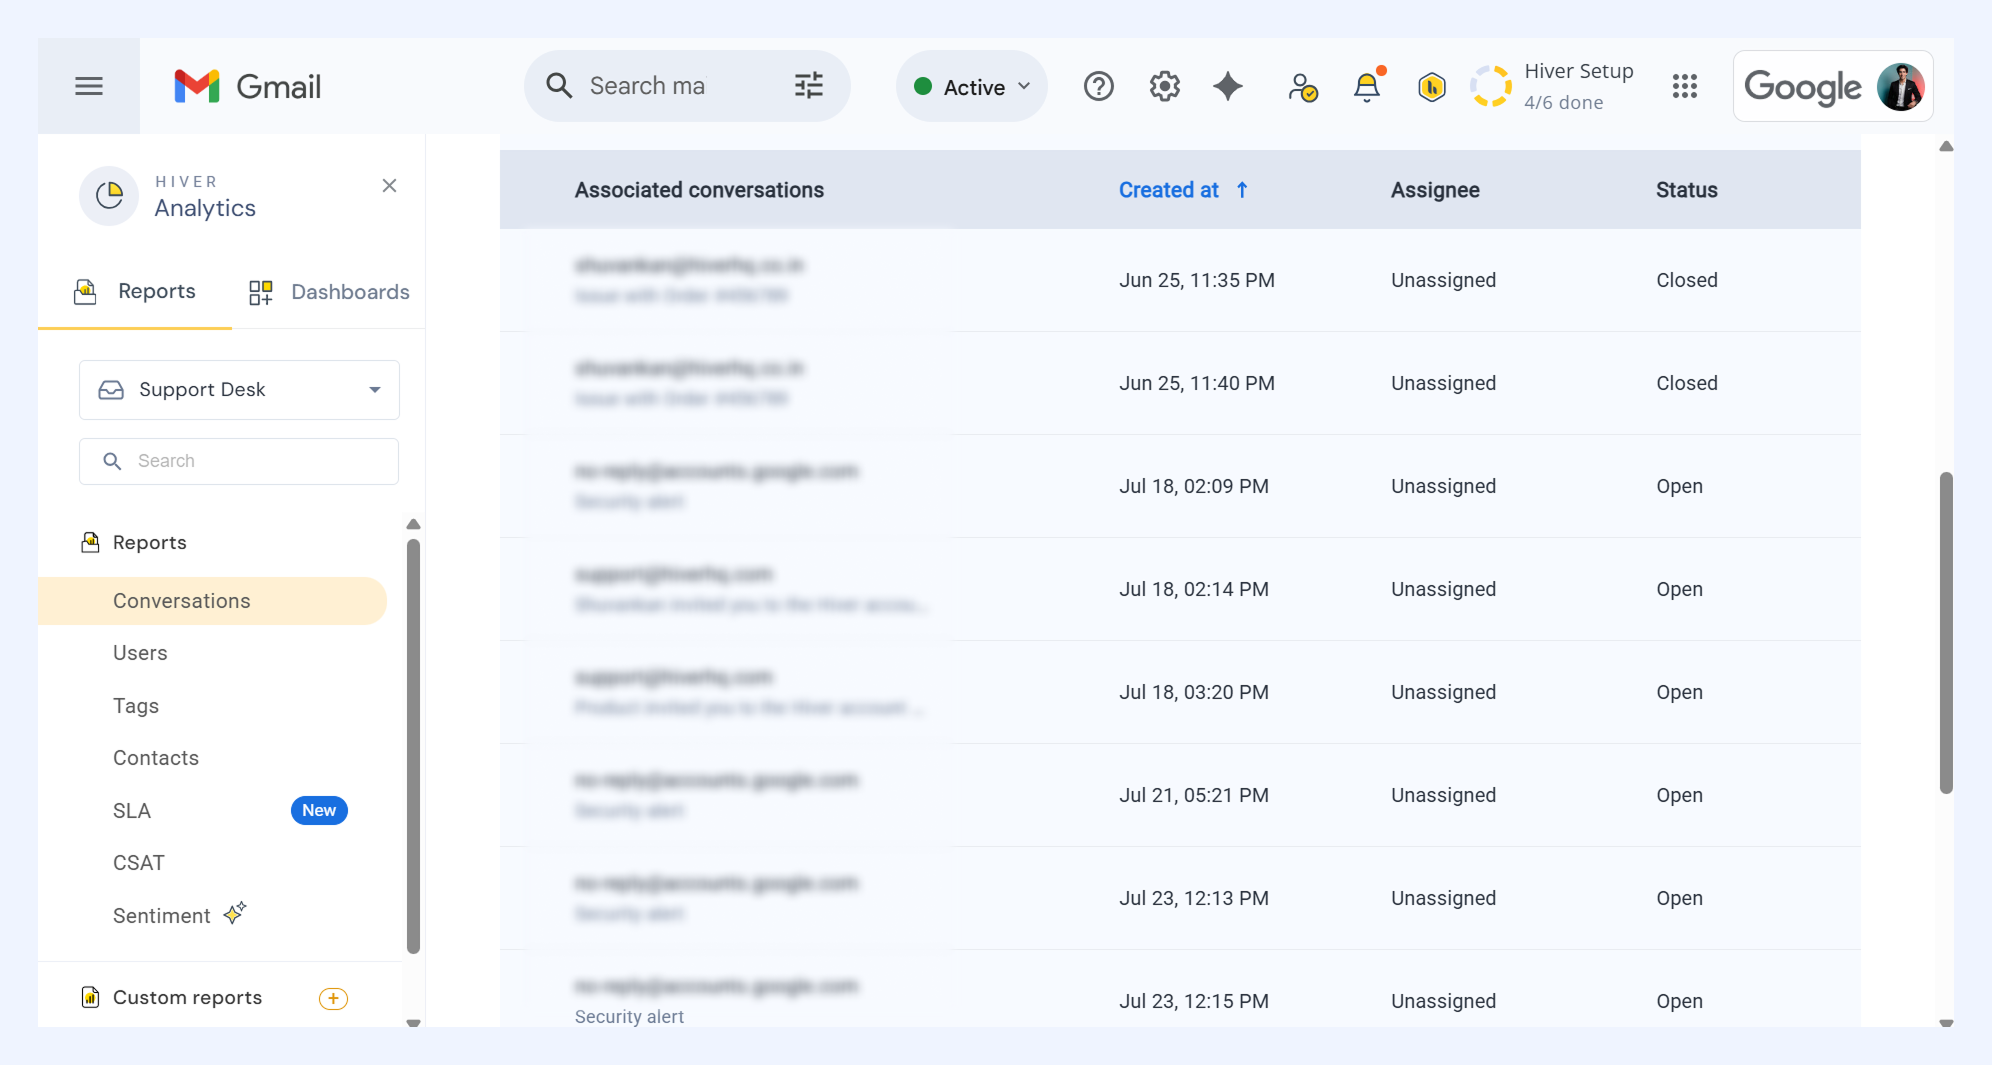
Click Analyze to explore the data further:
- Review each conversation’s details (with created at, assignee, and status).
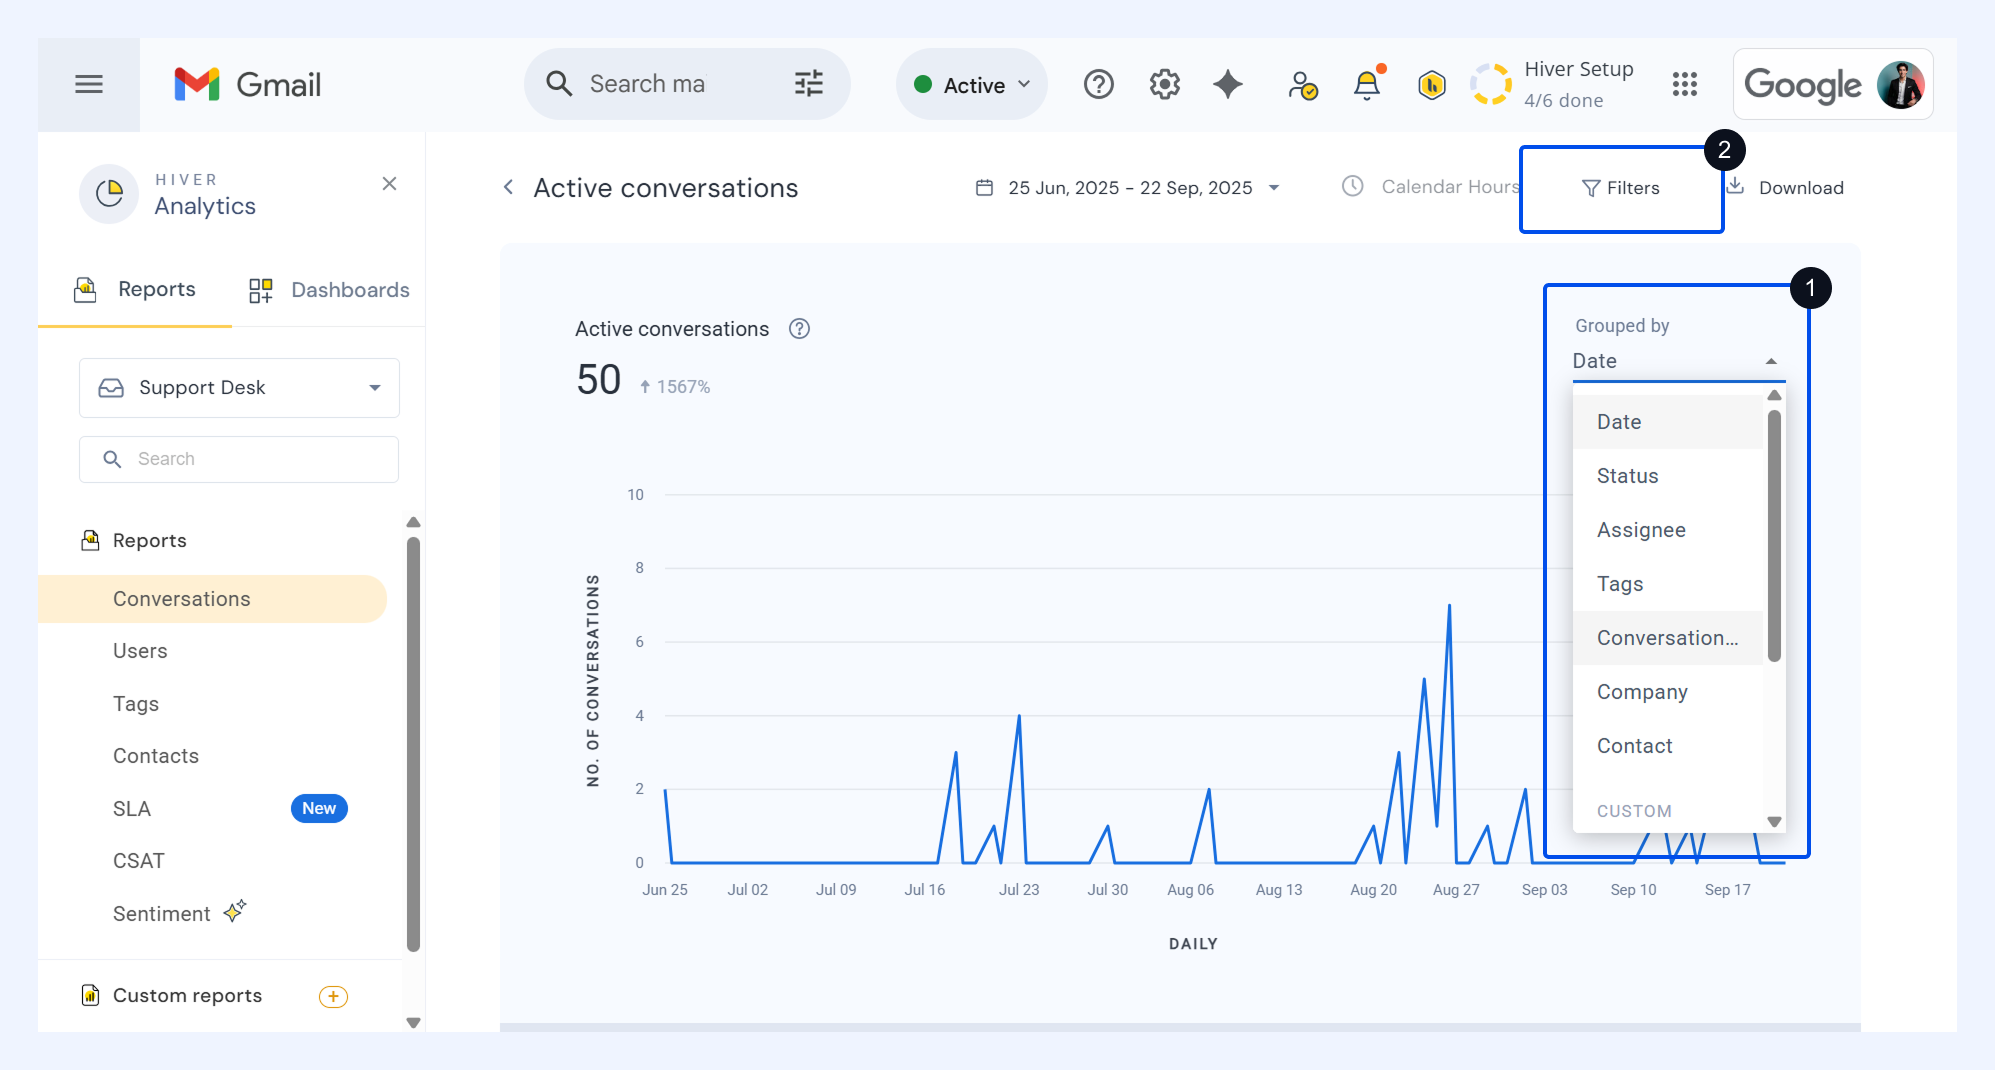
- Group data by date, status, assignee, tags, conversation type, company, contact, or custom fields.
- Apply filters to narrow results by assignee, tags, priority, or other key parameters.
New conversations
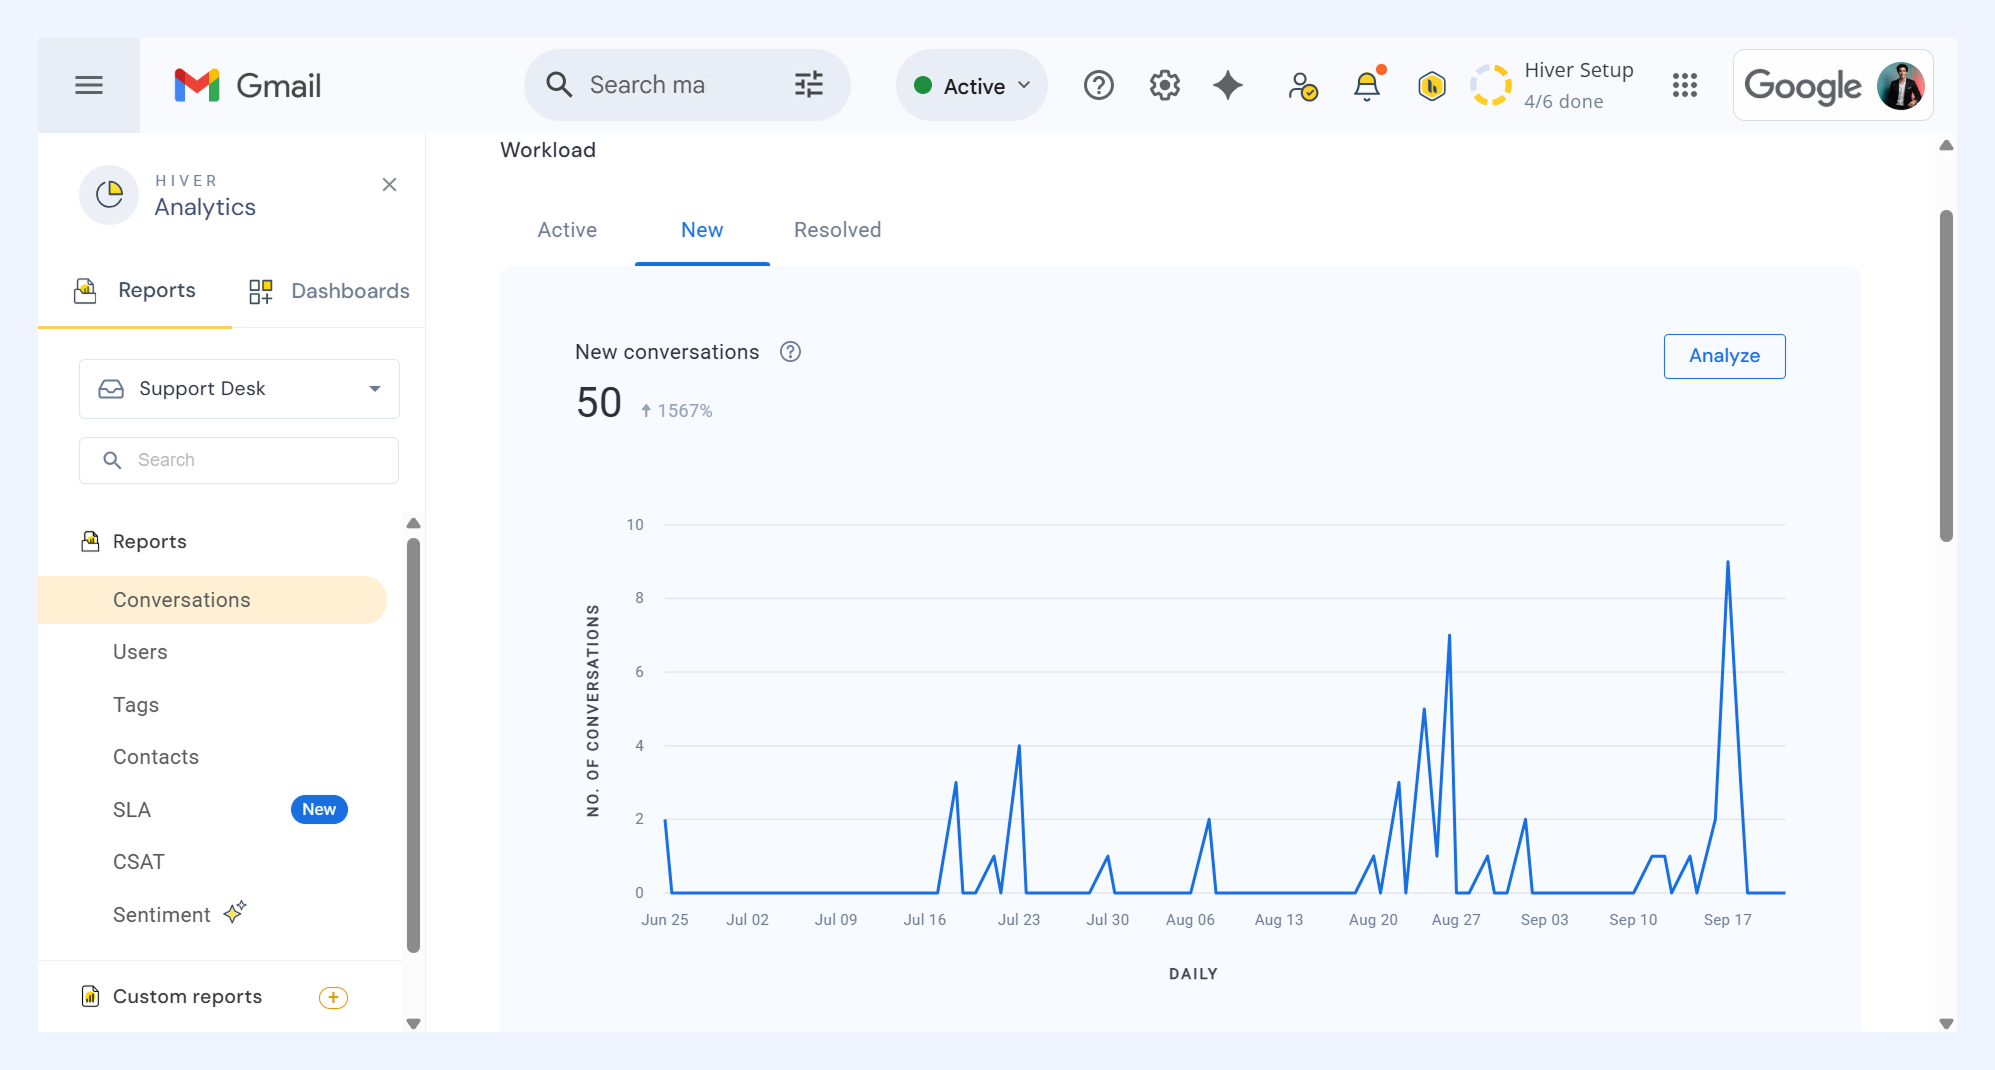
Includes all conversations that were started or manually added to the Shared Inbox during the selected reporting period.
Explore the report
The report’s overview includes:
i) The total number of new conversations.
ii) Percentage change in the number of new conversations in comparison to the previous timeframe of equal length.
Drill down
Click Analyze to go beyond the overview. You can:
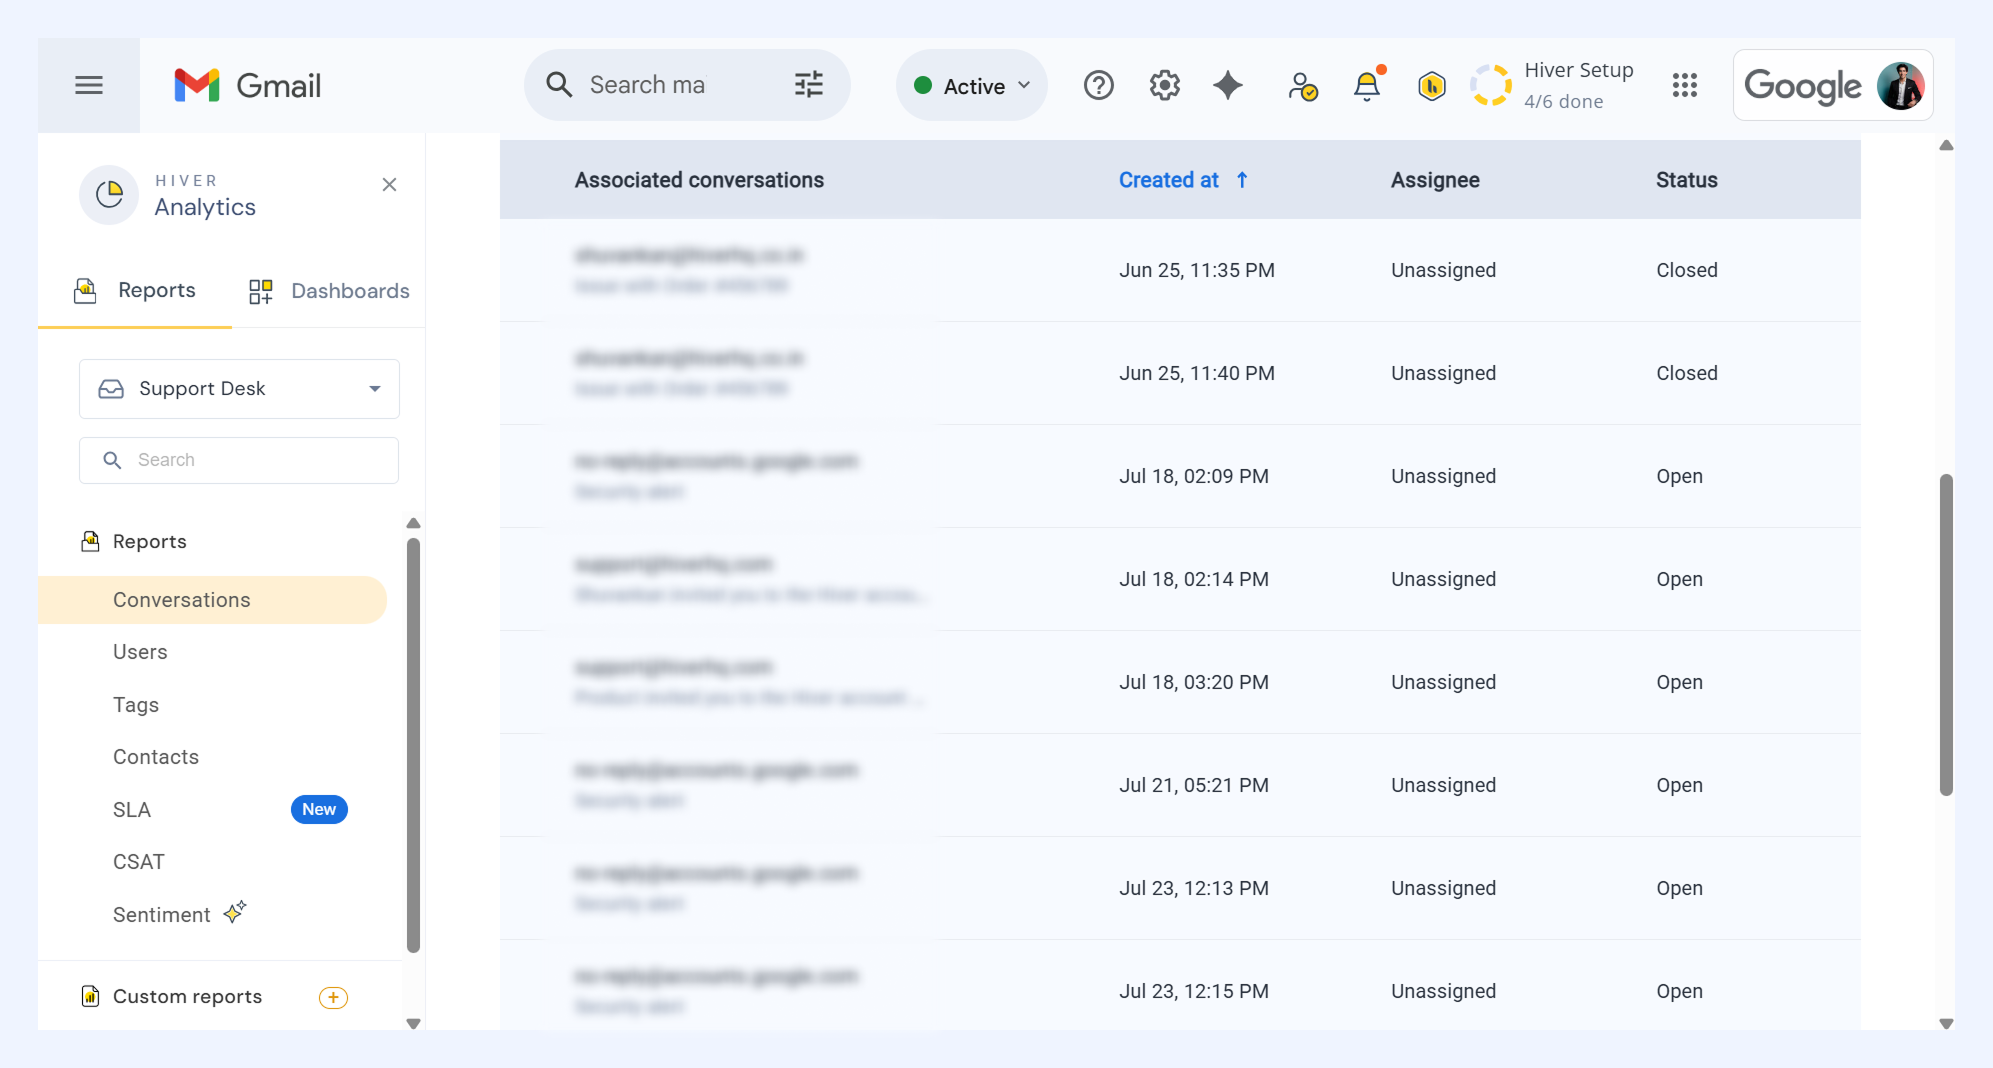
- View all conversations in the report, with details such as created at, assignee, and status (Open, Pending, Closed).
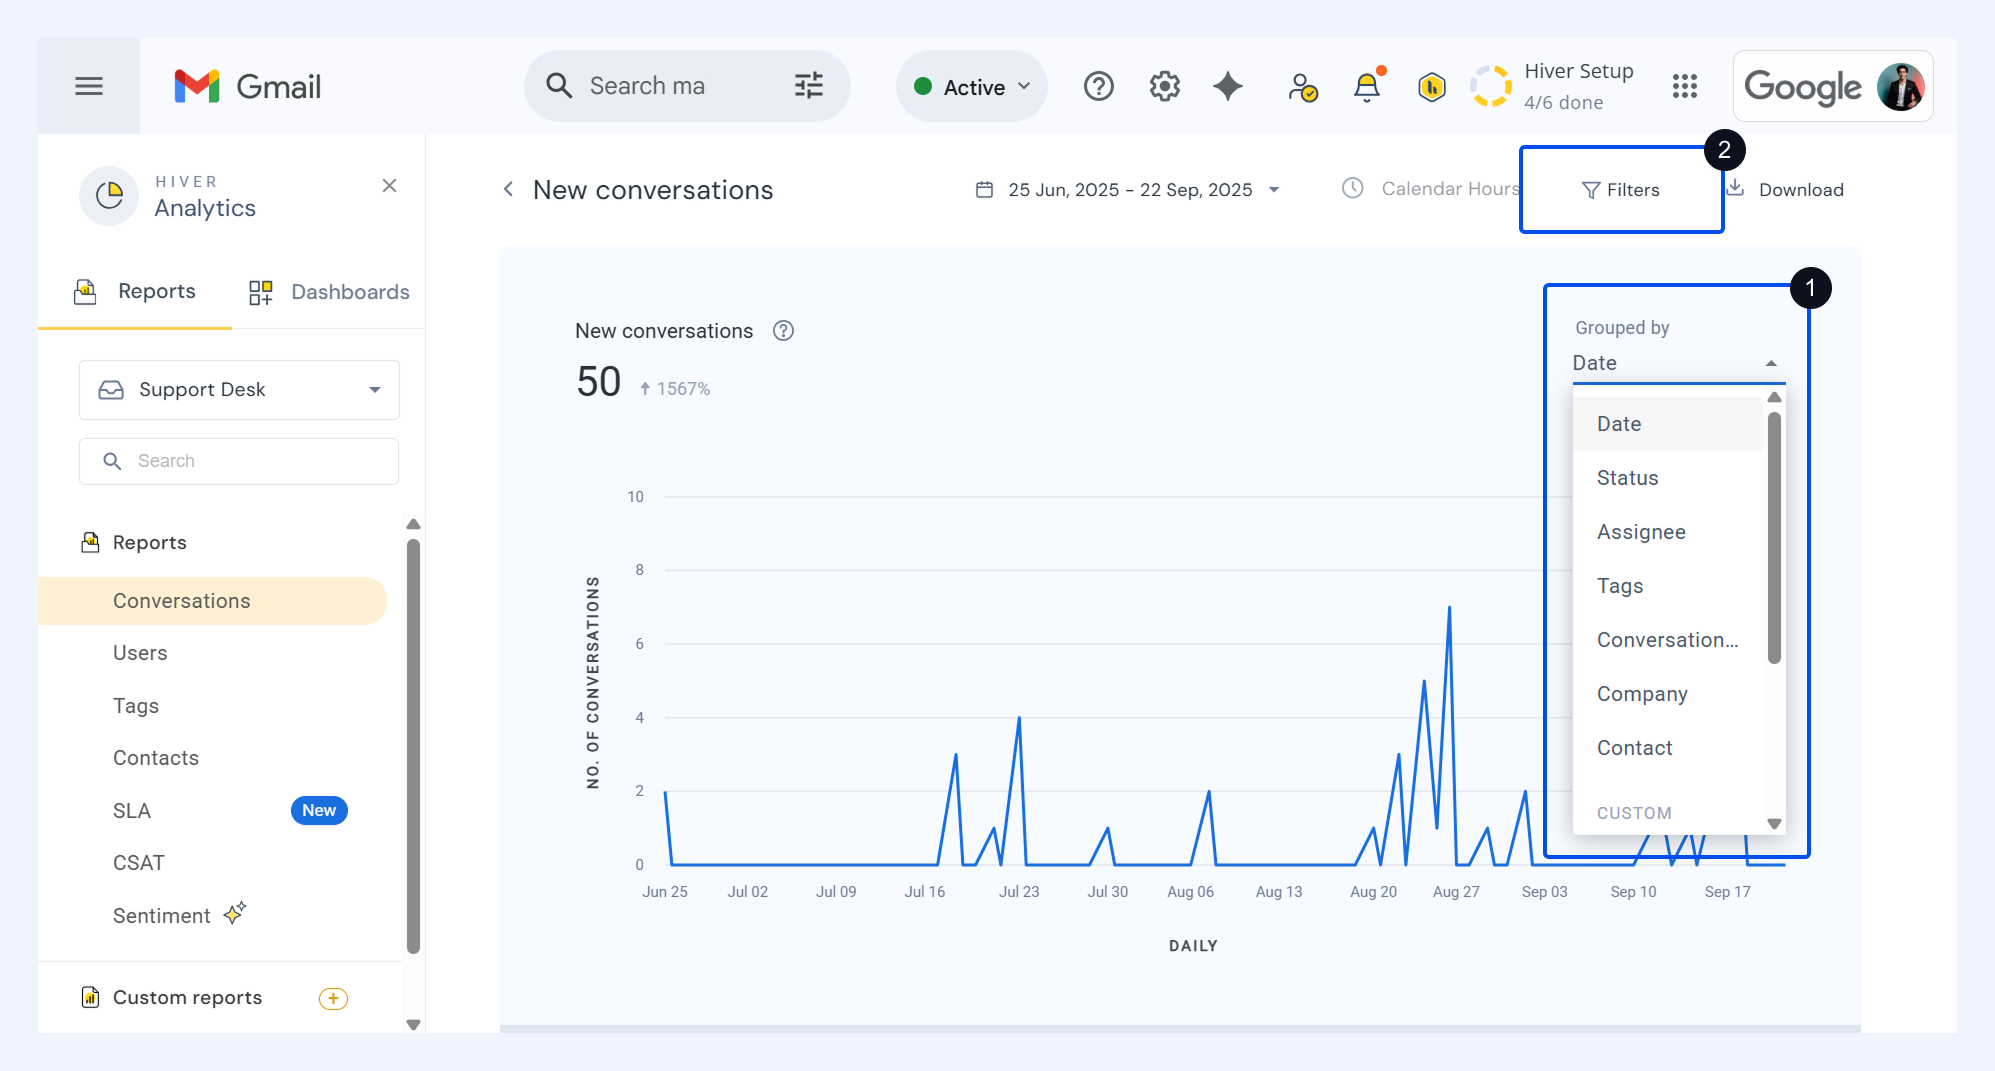
- Group data by date, status, assignee, tags, Conversation type (inbound, outbound, manually added), company, contact, or custom fields.
- Apply filters to narrow results by assignee, status, tags, conversation type, due date, priority, or custom fields.
Resolved conversations
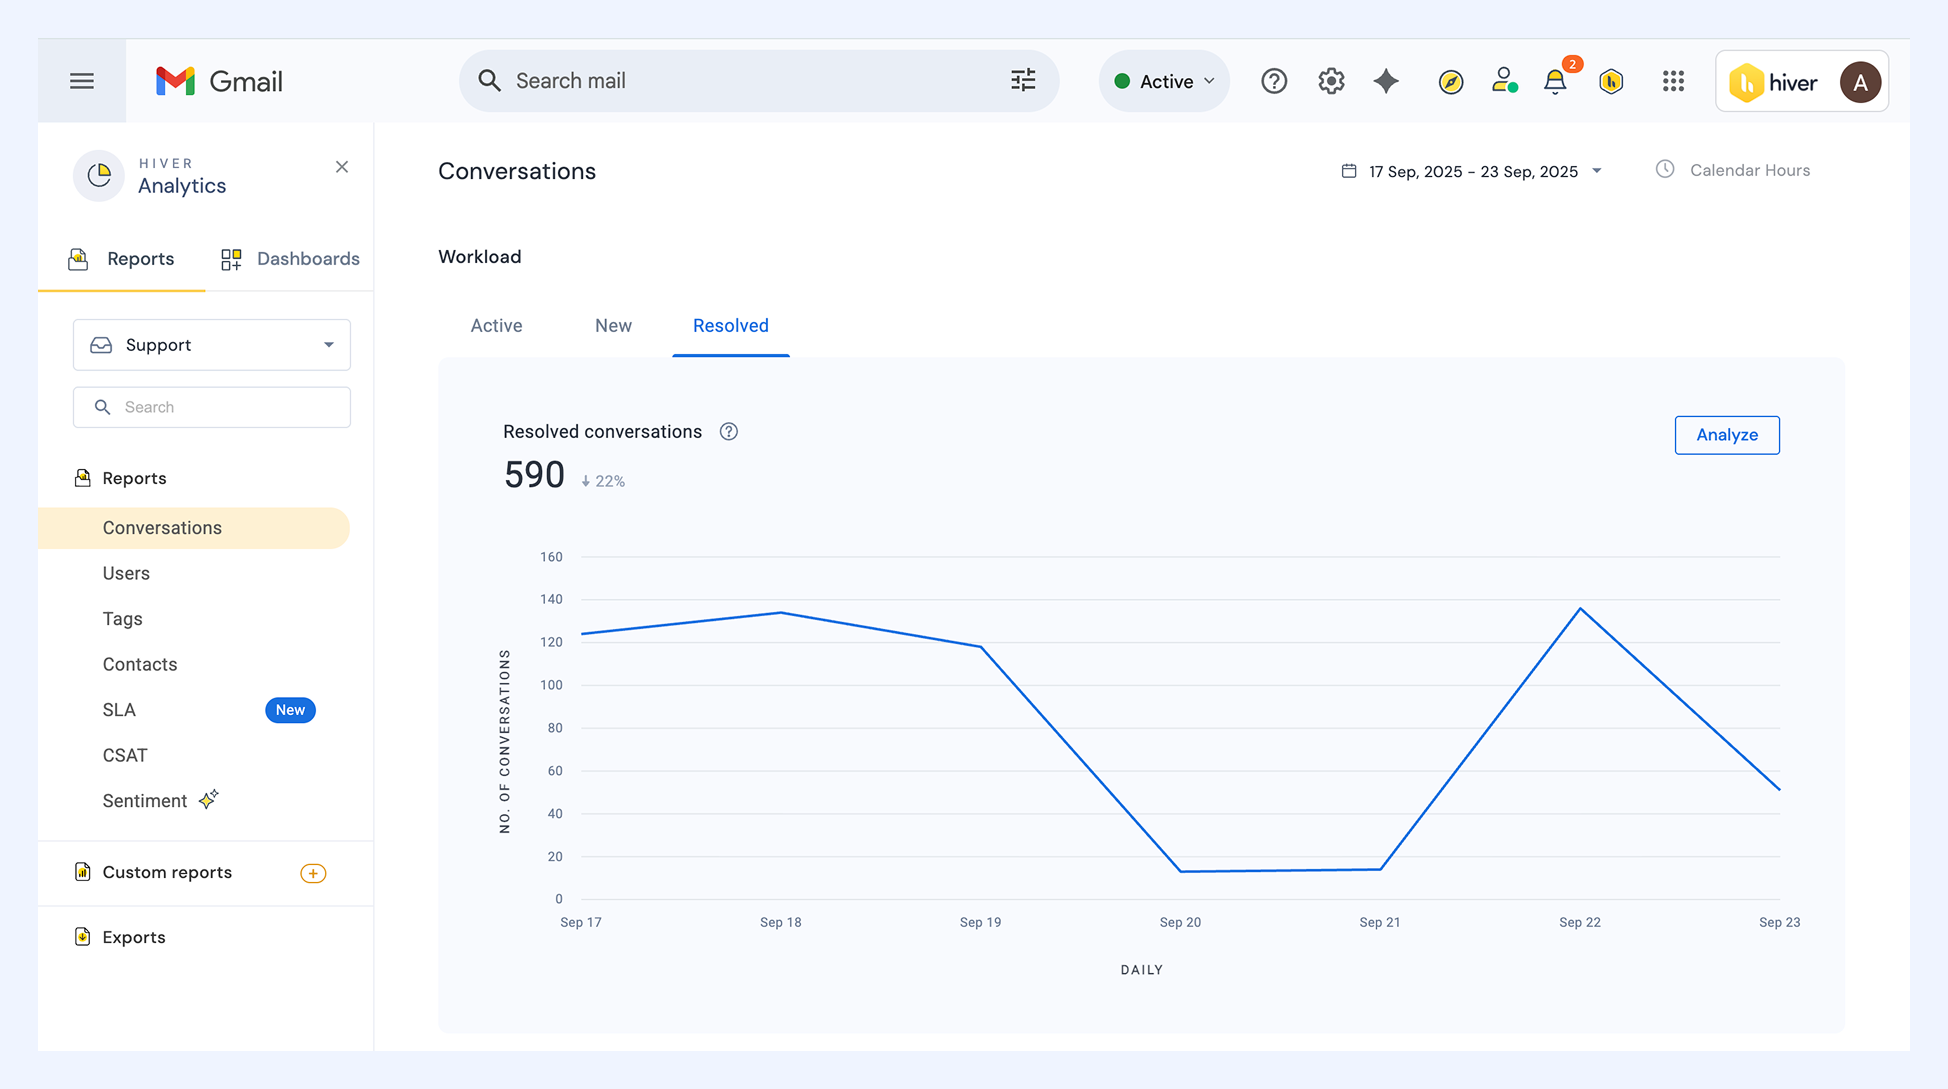
Shows all conversations that were closed during the reporting period and remained closed without being reopened.
Explore the report
The report’s overview includes:
i) The total number of resolved conversations.
ii) Percentage change in the number of resolved conversations in comparison to the previous timeframe of equal length.
Drill down
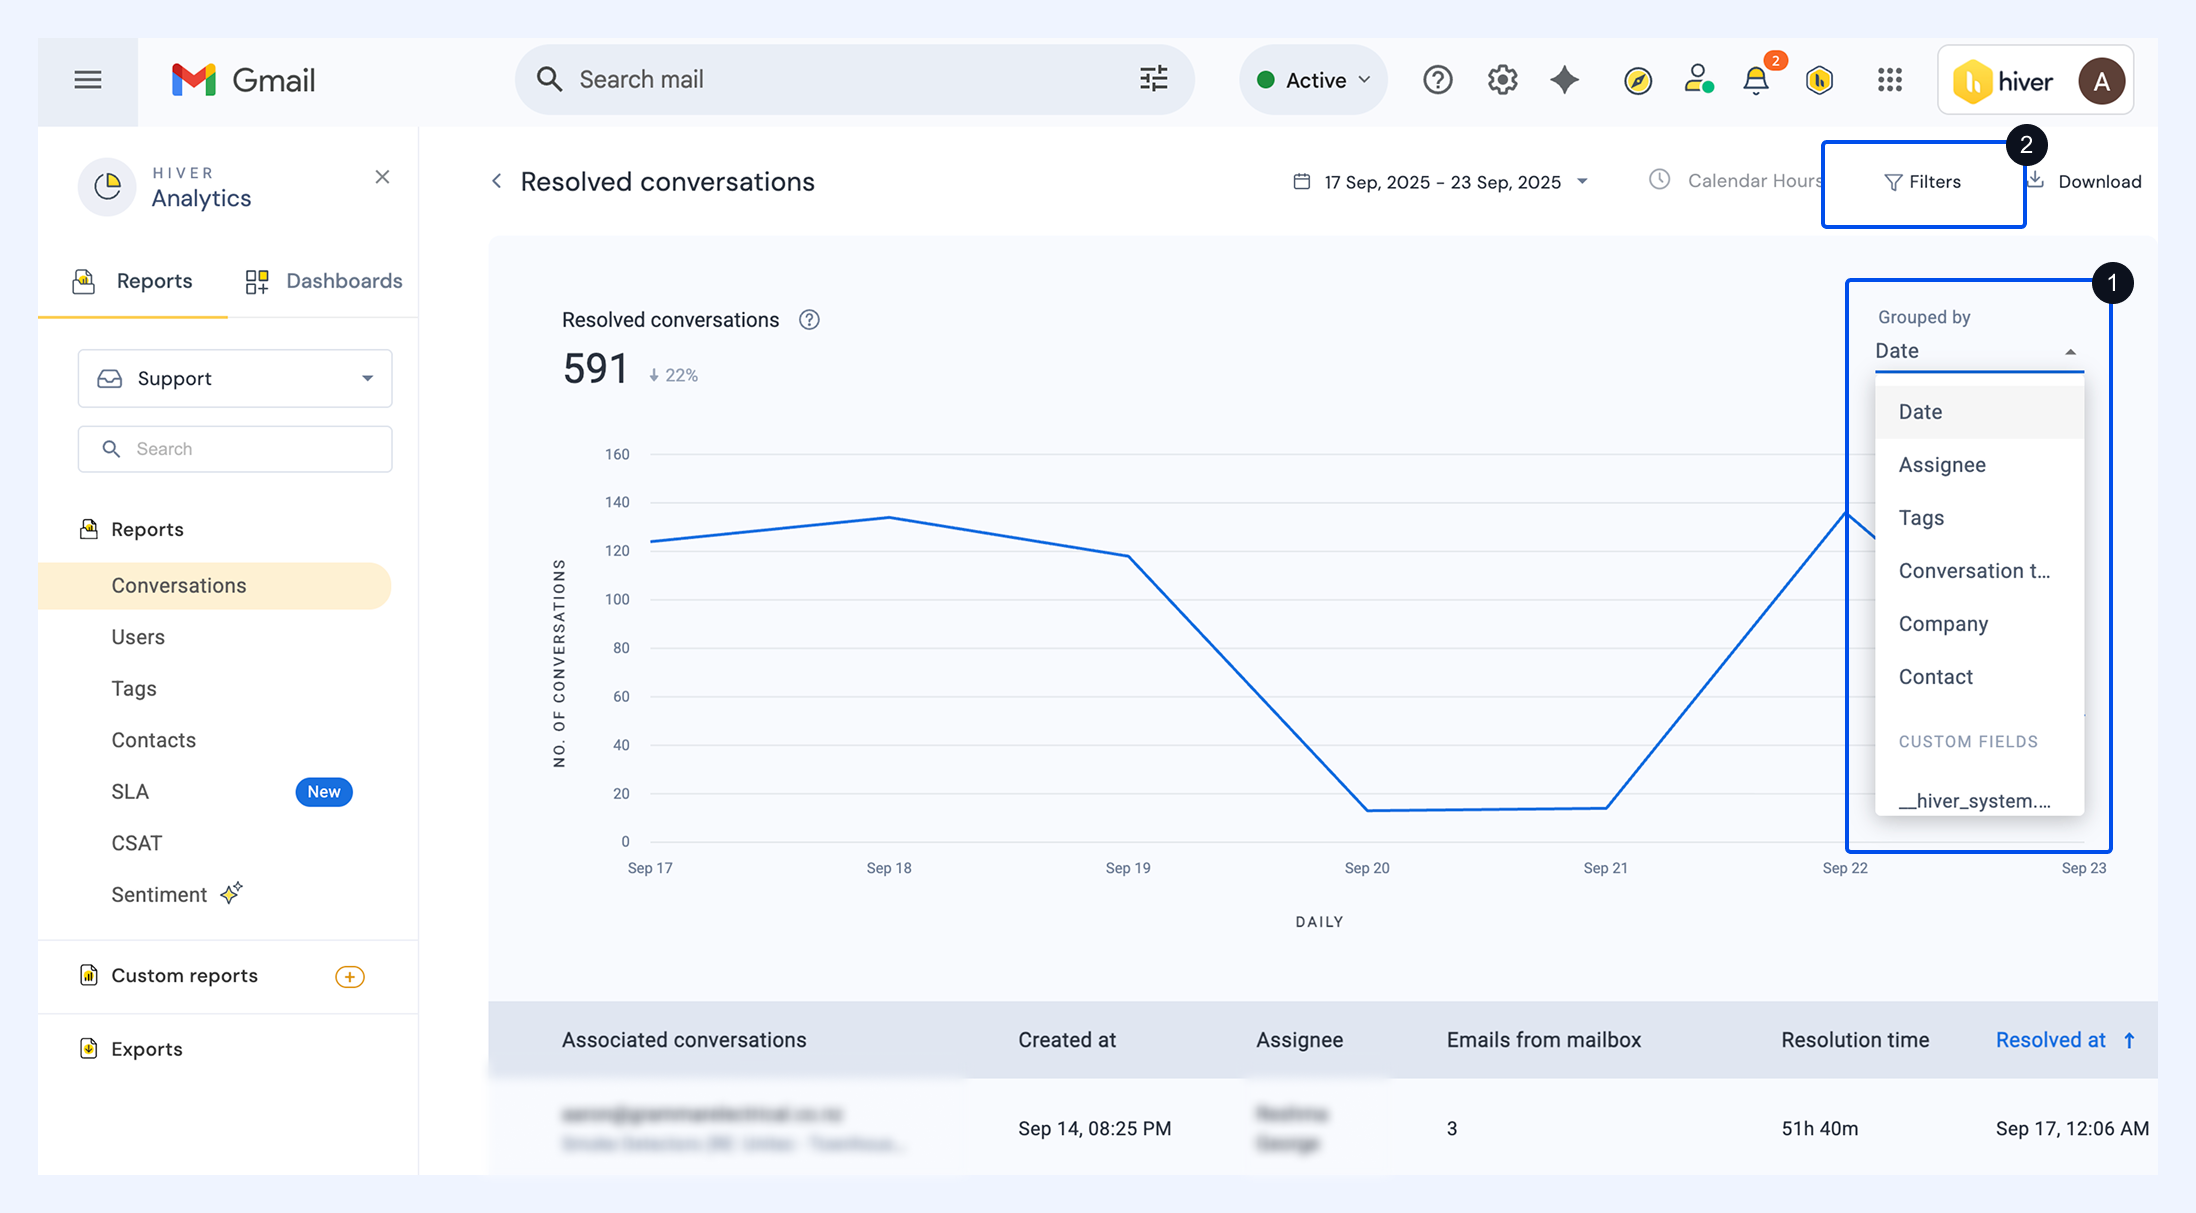
Select Analyze to go beyond the overview. You can:
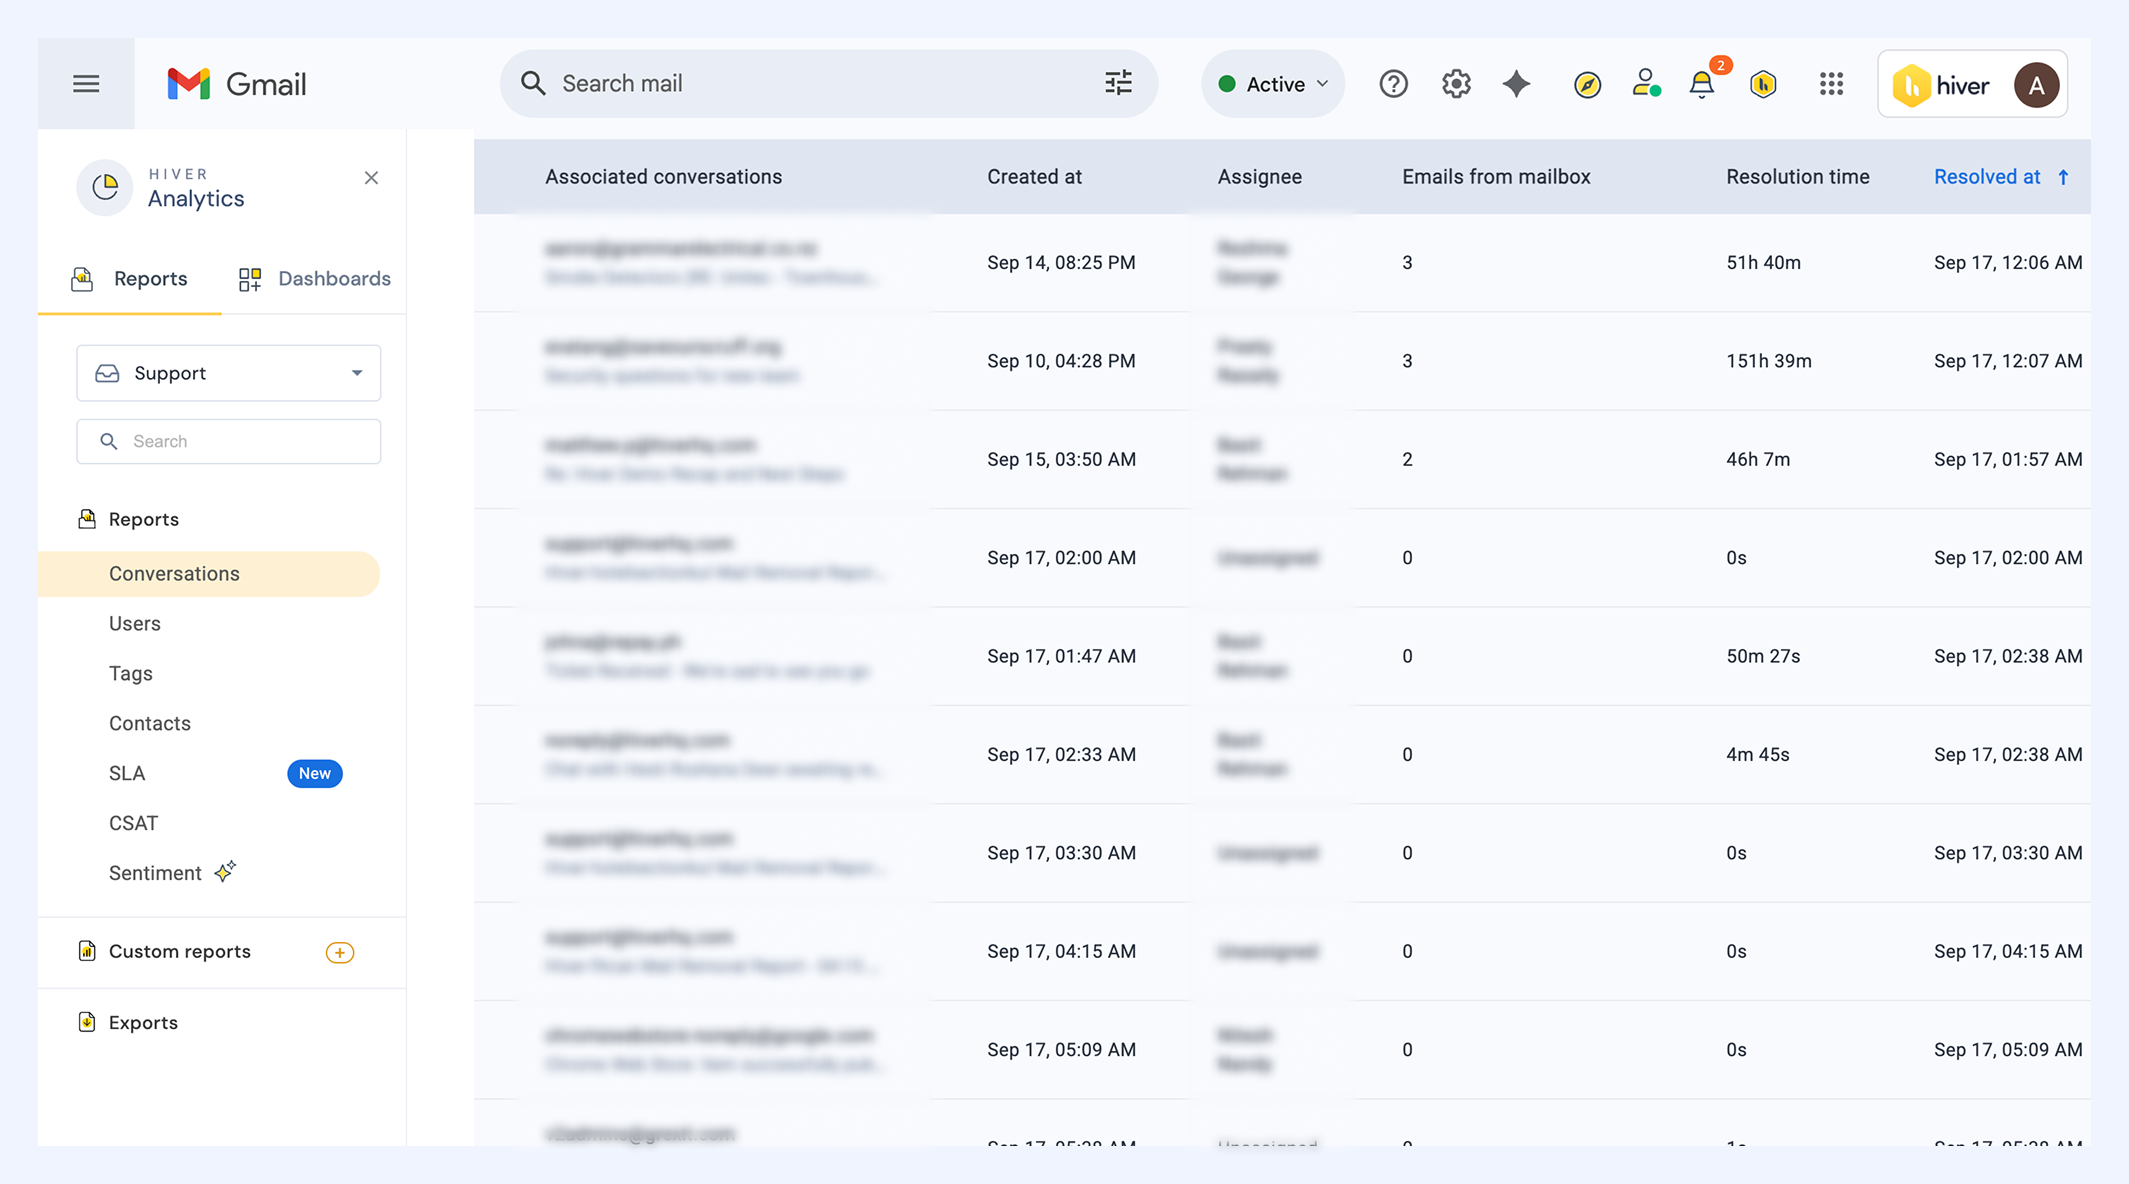
- View all conversations in the report, including details such as created at, assignee, emails from mailbox, resolution time, and resolved at.
- Group data by date, assignee, tags, conversation type, company, contact, or custom fields.
- Apply filters to view results by assignee, tags, conversation type, due date, priority, or custom fields.
Performance metrics
The performance section helps you analyze how efficiently your team handles conversations in Hiver in Gmail. You can track key response and resolution metrics to find opportunities for faster, consistent support.
First response time
Tracks how quickly your team sends the first reply in a conversation. It includes all first responses sent during the selected period, even if the conversation started earlier.
Calculation
Average First Response Time = Total of all first response times ÷ Number of conversations with a response.
Explore the report
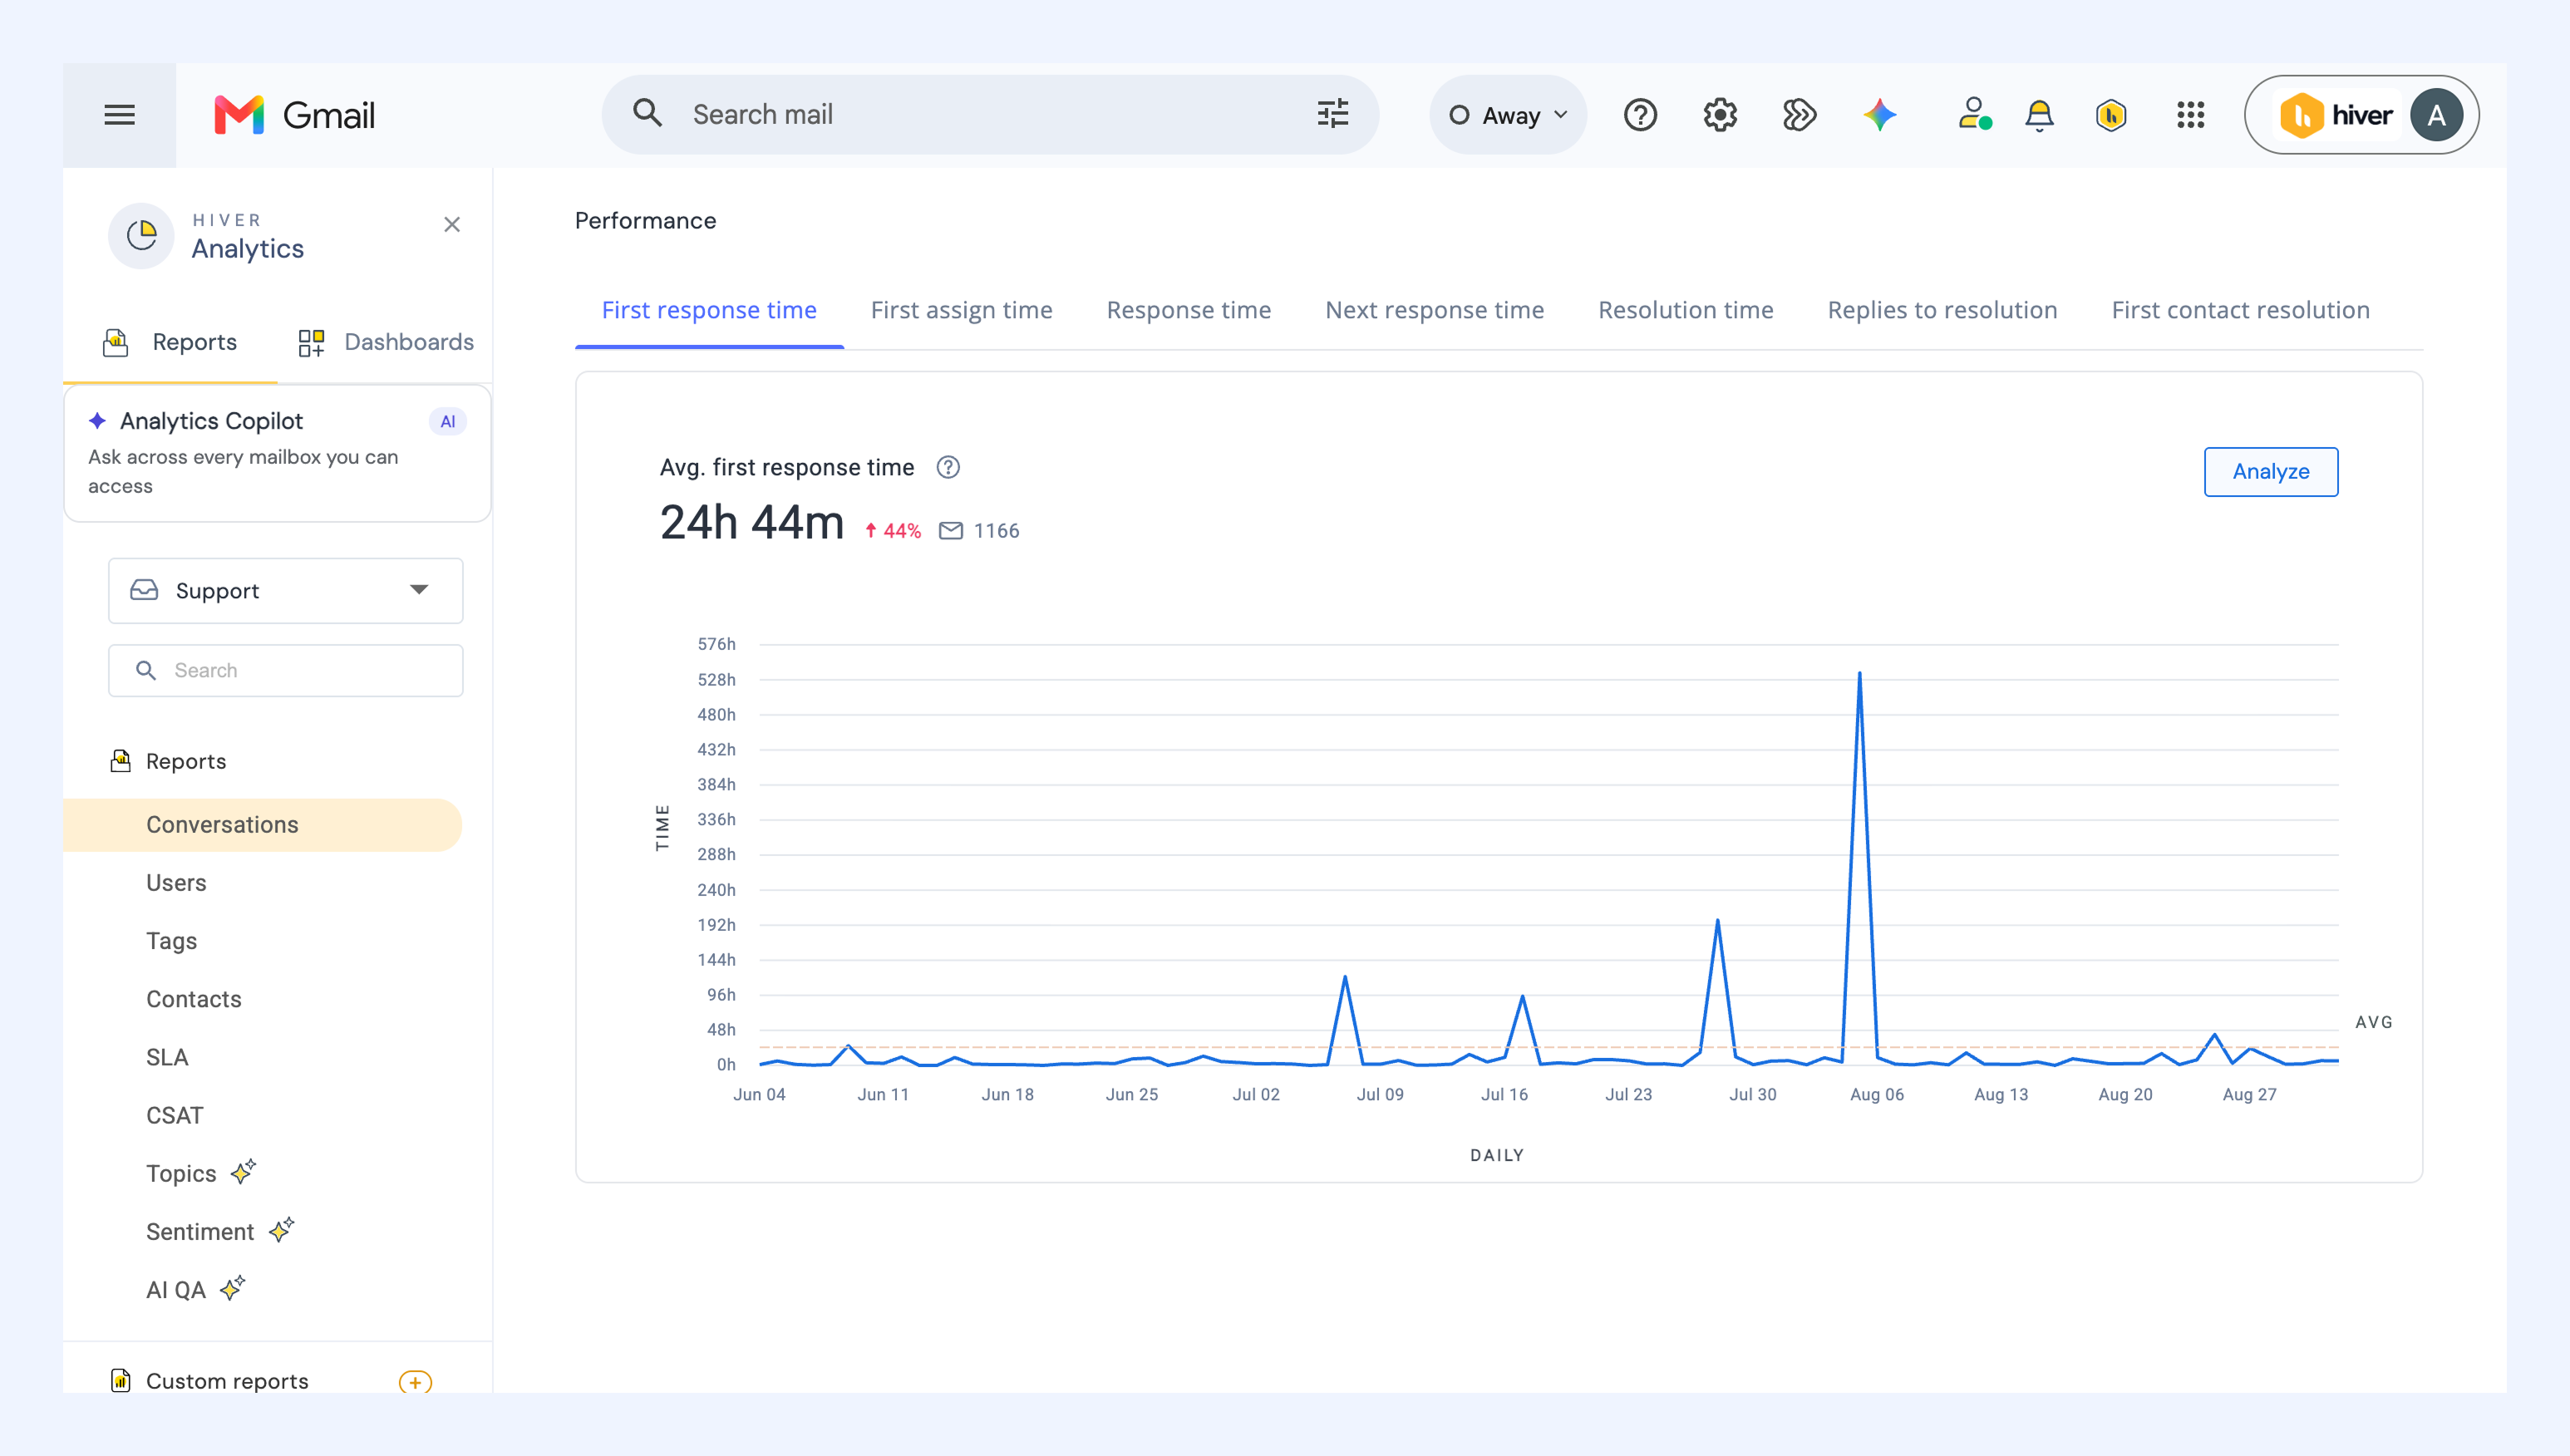
The report’s overview includes:
i) The average first response time.
ii) Percentage change in average first response time compared to previous timeframe of equal length.
iii) Daily trend chart showing the first response time.
Drill down
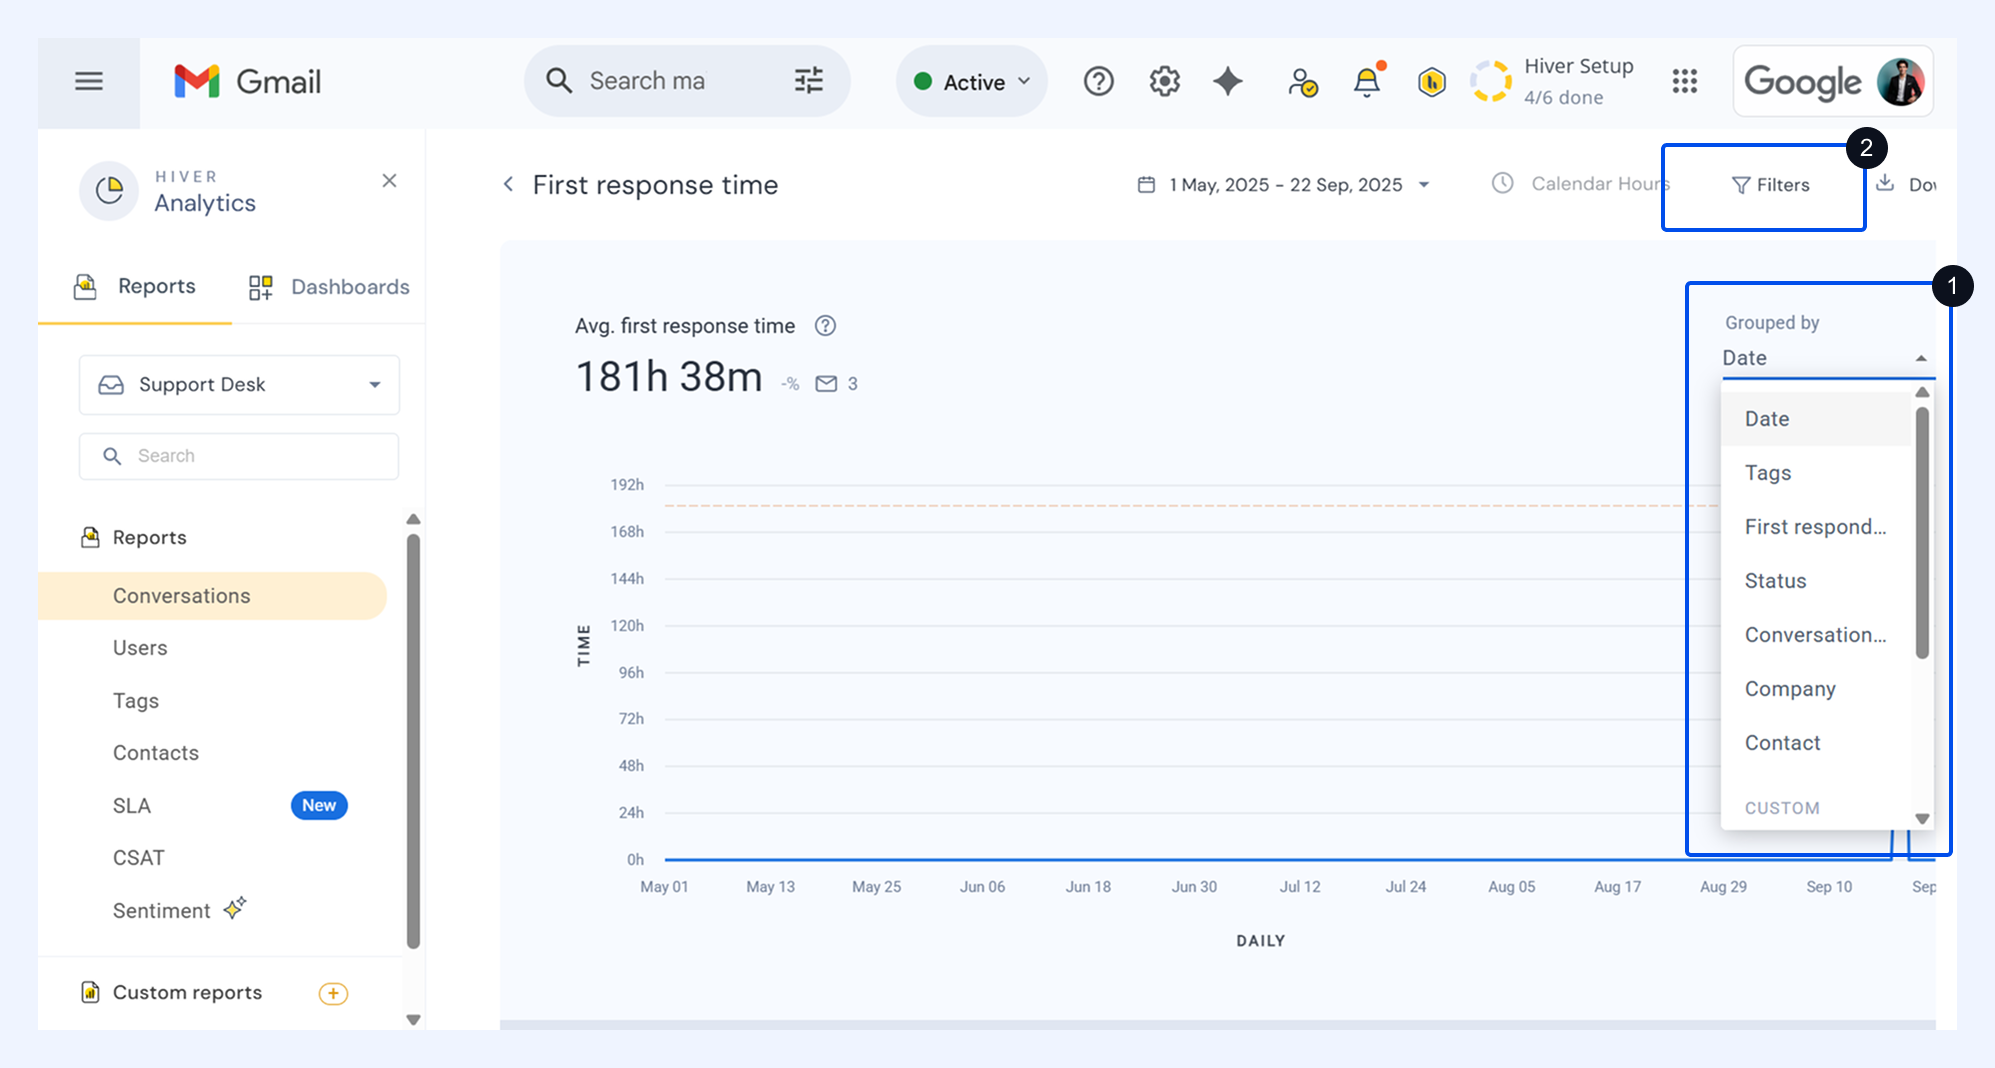
Click Analyze to check the data further in detail. You can:
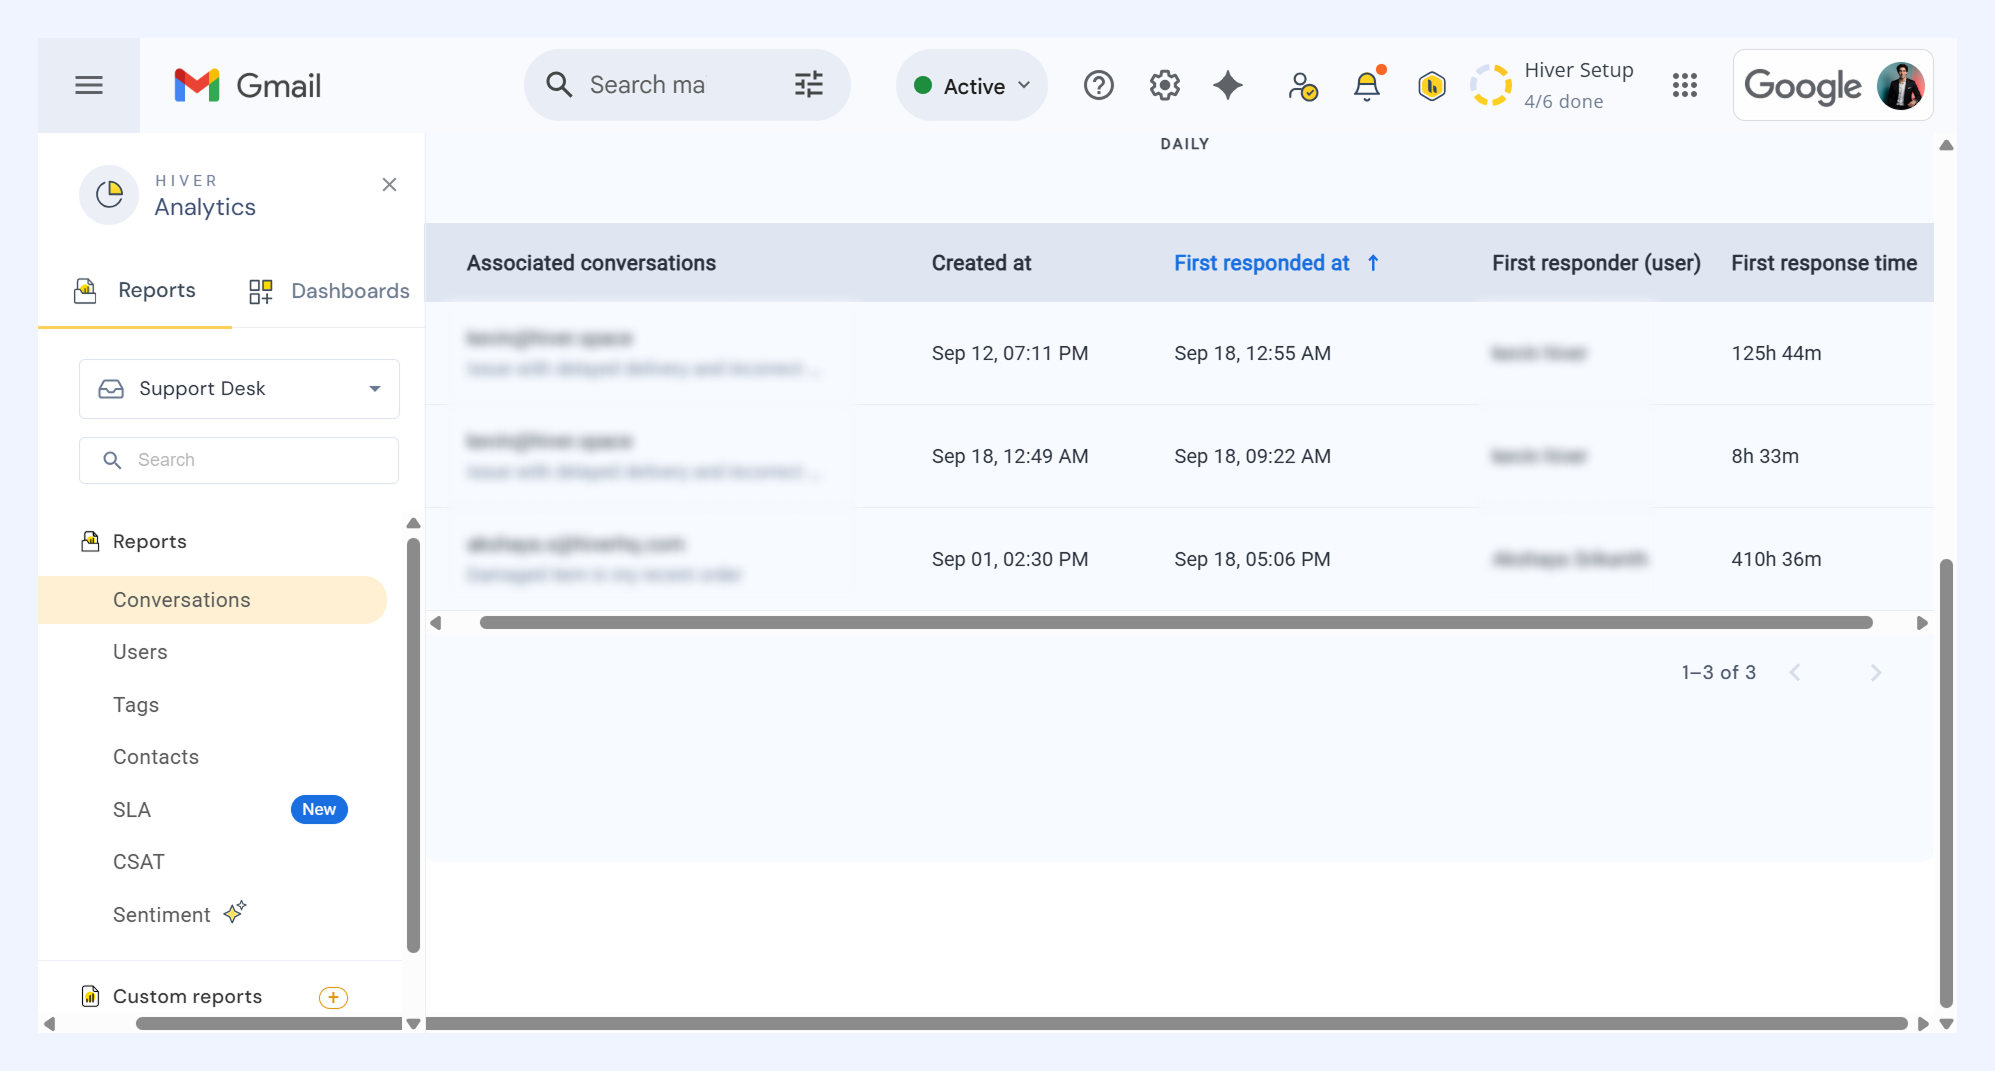
- View all conversations in the report, with parameters such as created at, first responded at, first responder (user), and first response time.
- Group data by date, tags, first responders, status, or conversation type (inbound, outbound, manually added), company, contact, or custom fields.
- Apply filters to narrow down results by first responder, status, tags, conversation type, due date, priority, or custom fields.
First assign time
Measures how long it takes for a conversation to be assigned for the first time after entering a Shared Inbox. This includes all conversations first assigned during the selected period, no matter when they started or were added.
Calculation
Average First Assign Time = Total assign time ÷ Number of conversations assigned during the period.
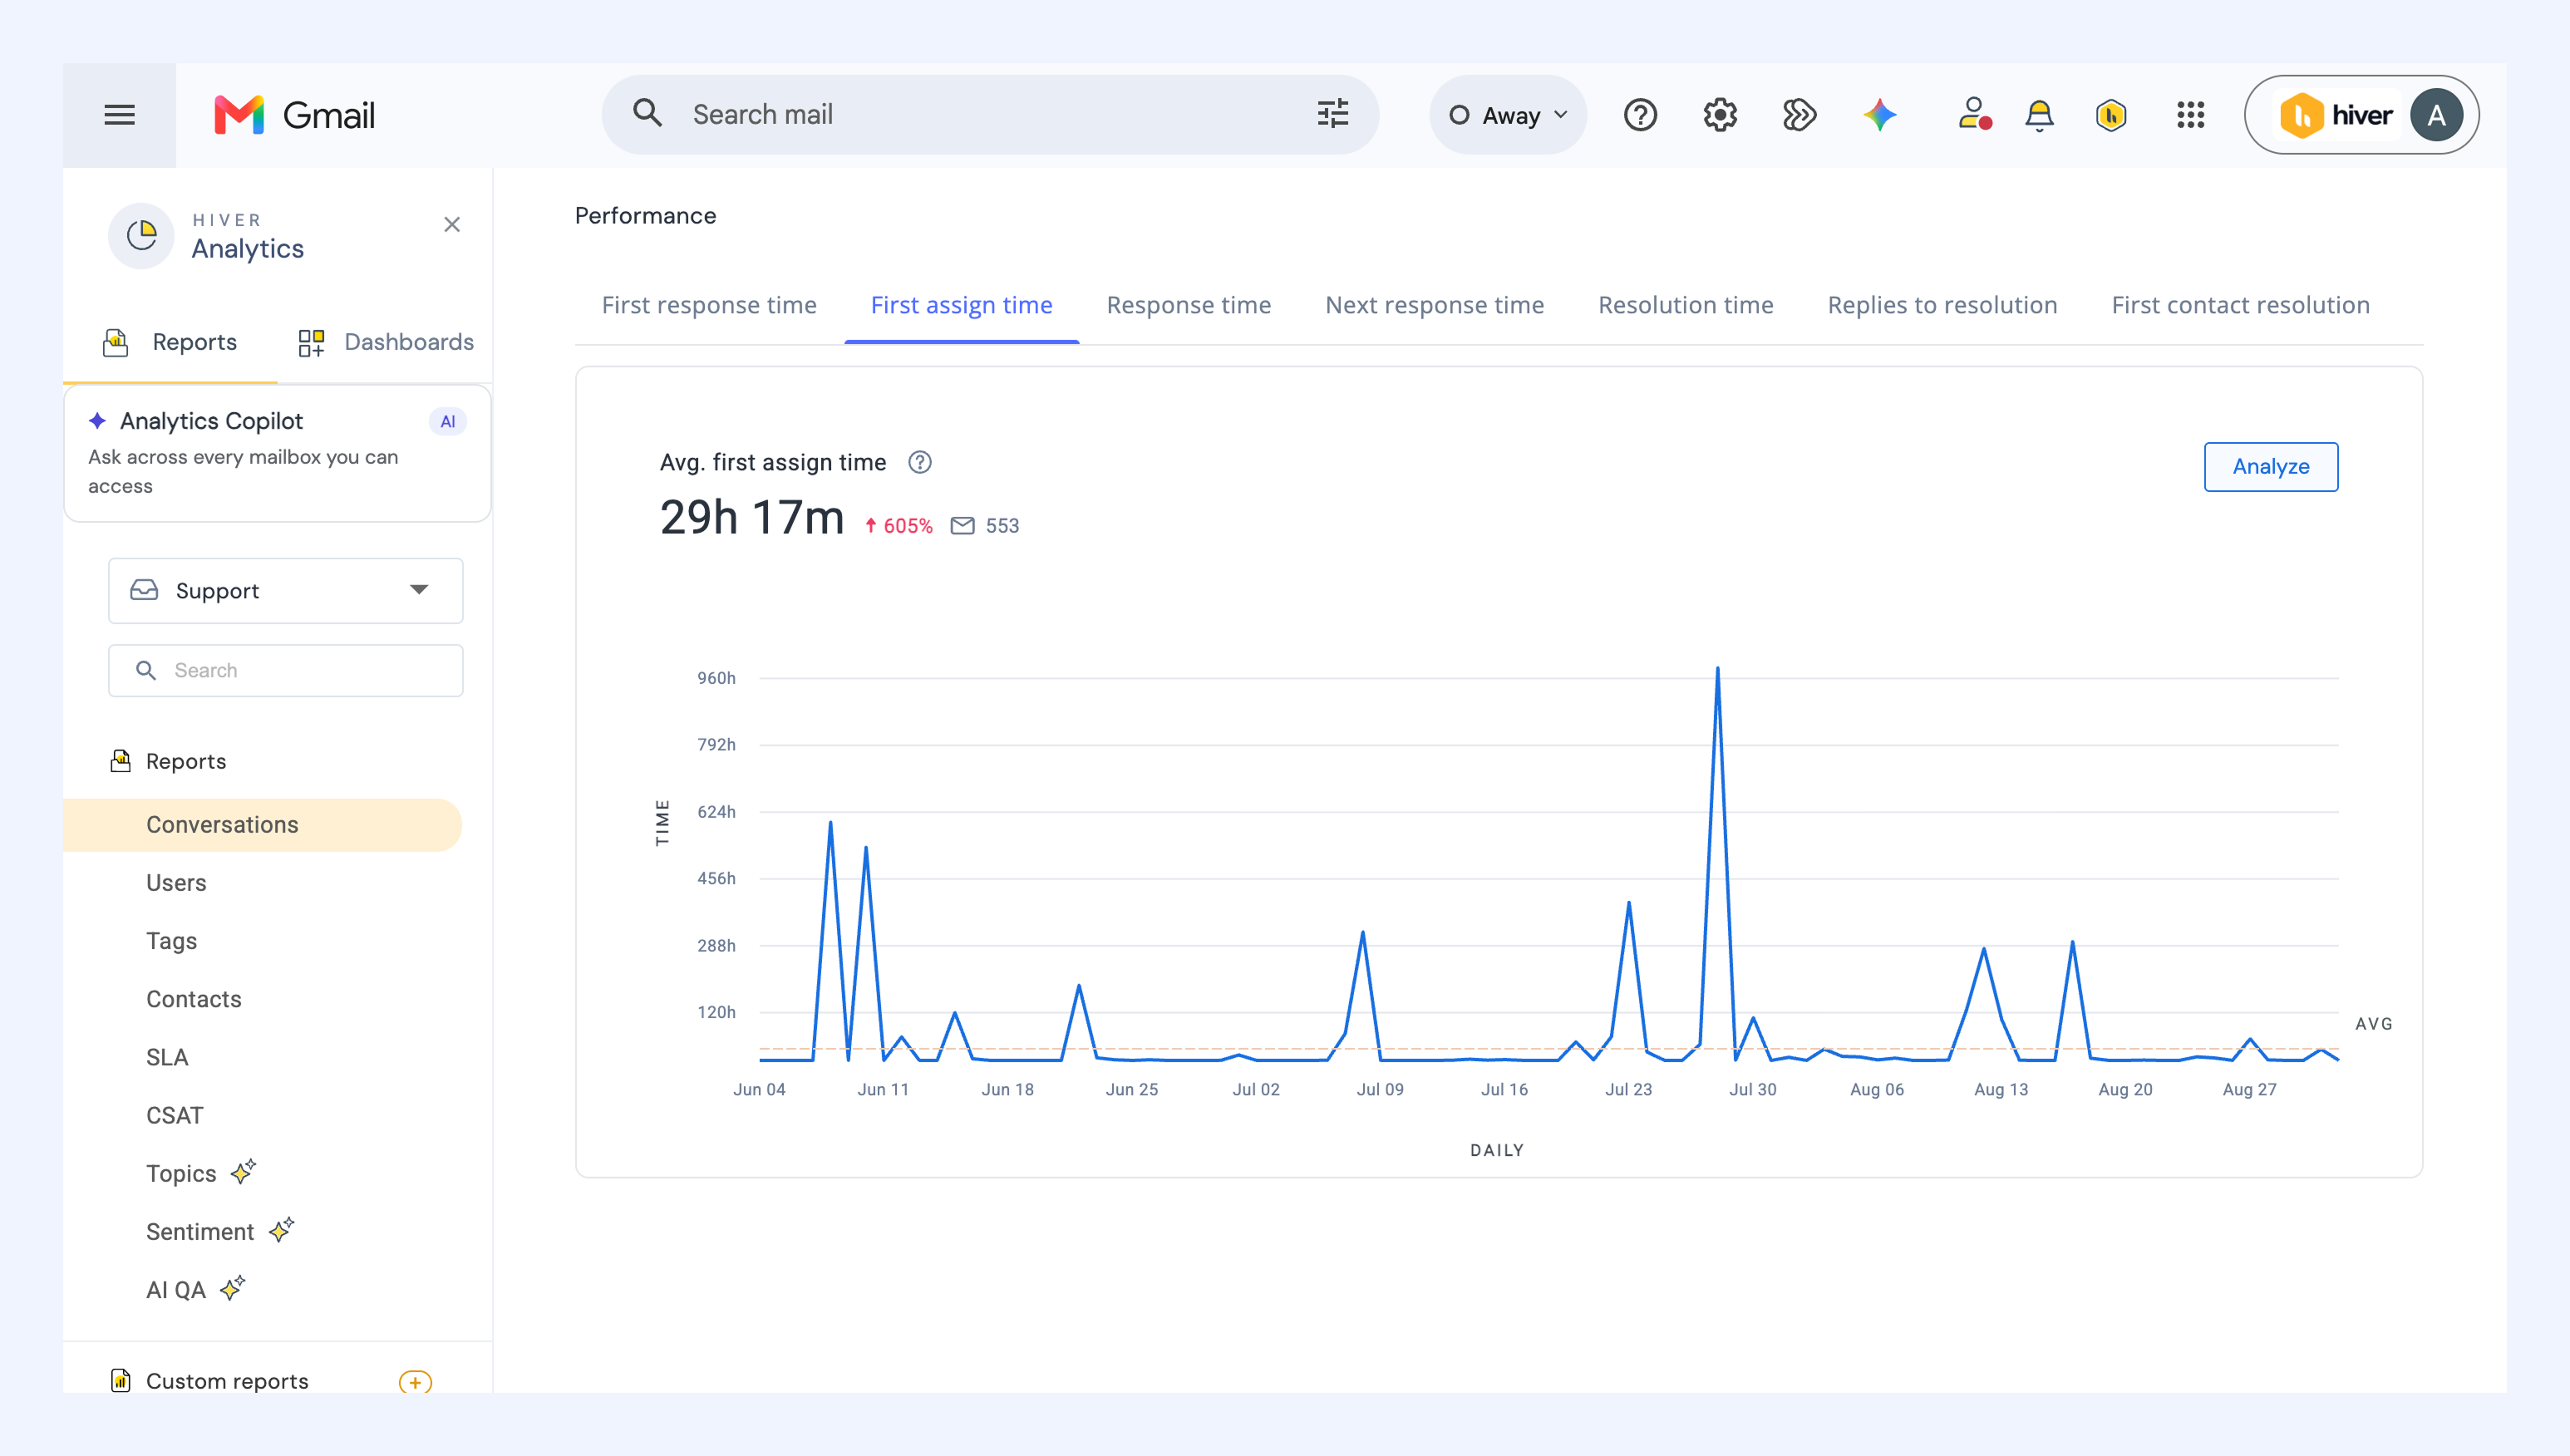
Explore the report
The report’s overview includes:
i) The average first assign time
ii) Percentage change in average first assign time in comparison to the previous timeframe of equal length
iii) Daily trend chart showing the first assign time
Drill down
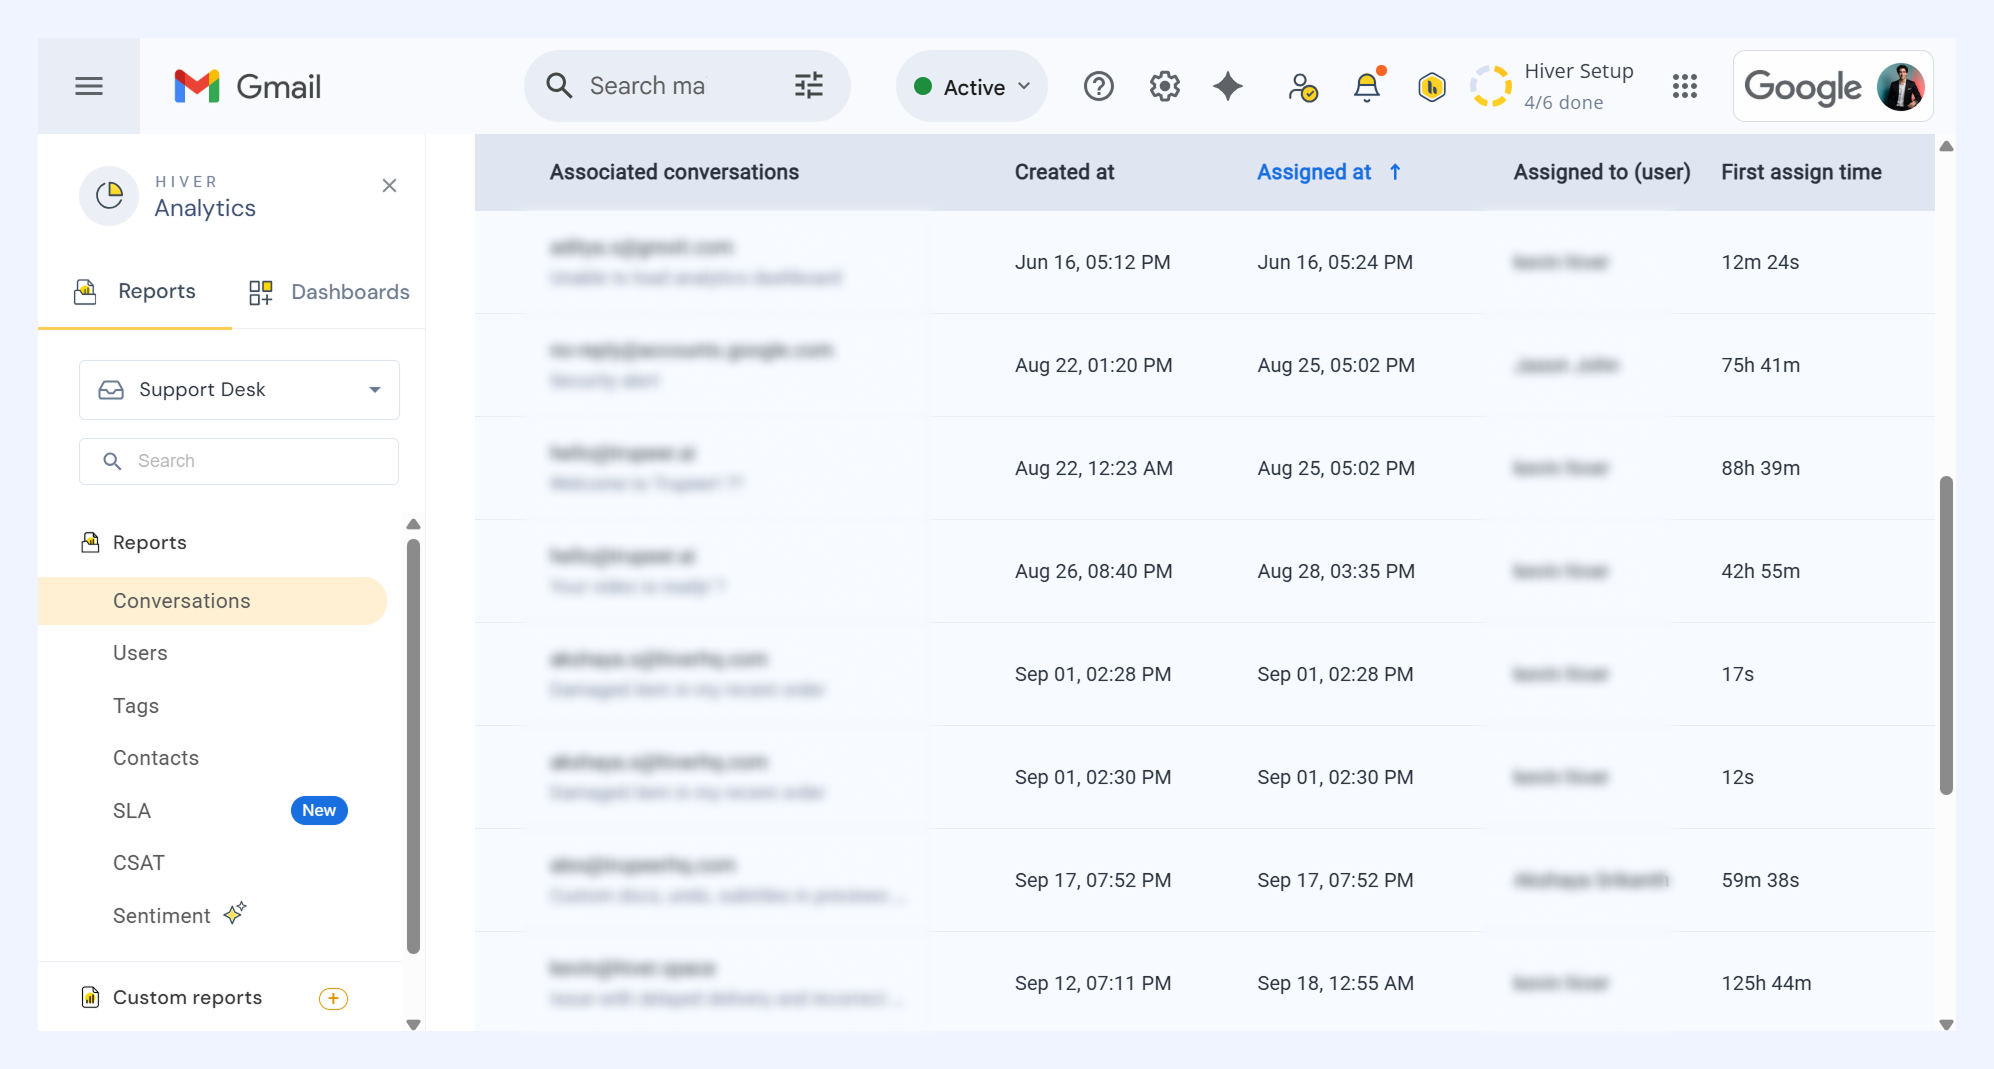
Click Analyze to go beyond the overview. You can:
- View all conversations in the report, including details such as created at, assigned at, assigned to (user), and first assign time.
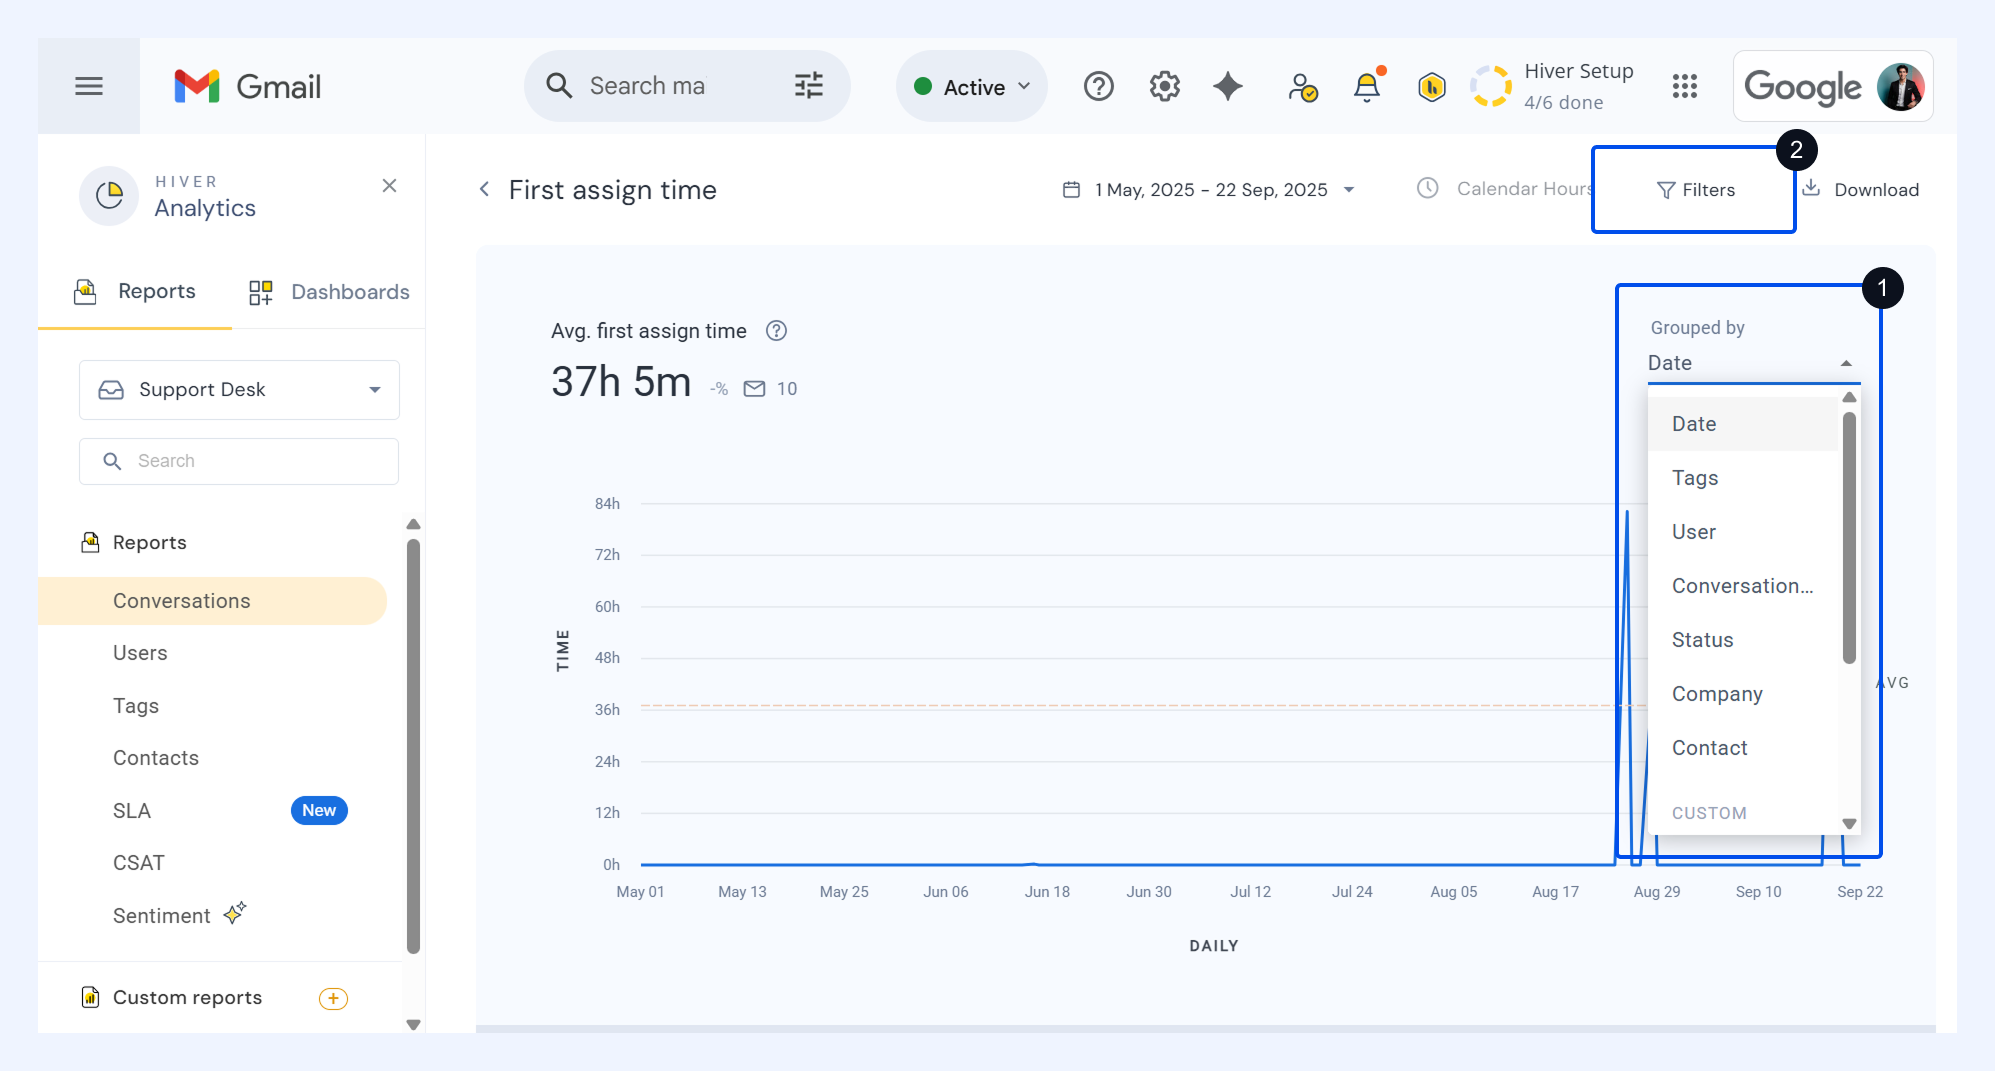
- Group data by date, tags, users, conversation type (inbound, outbound, manually added), or status, company, contact, or custom fields.
- Filters results by assigned to, status, tags, or conversation type, due date, priority, or custom fields.
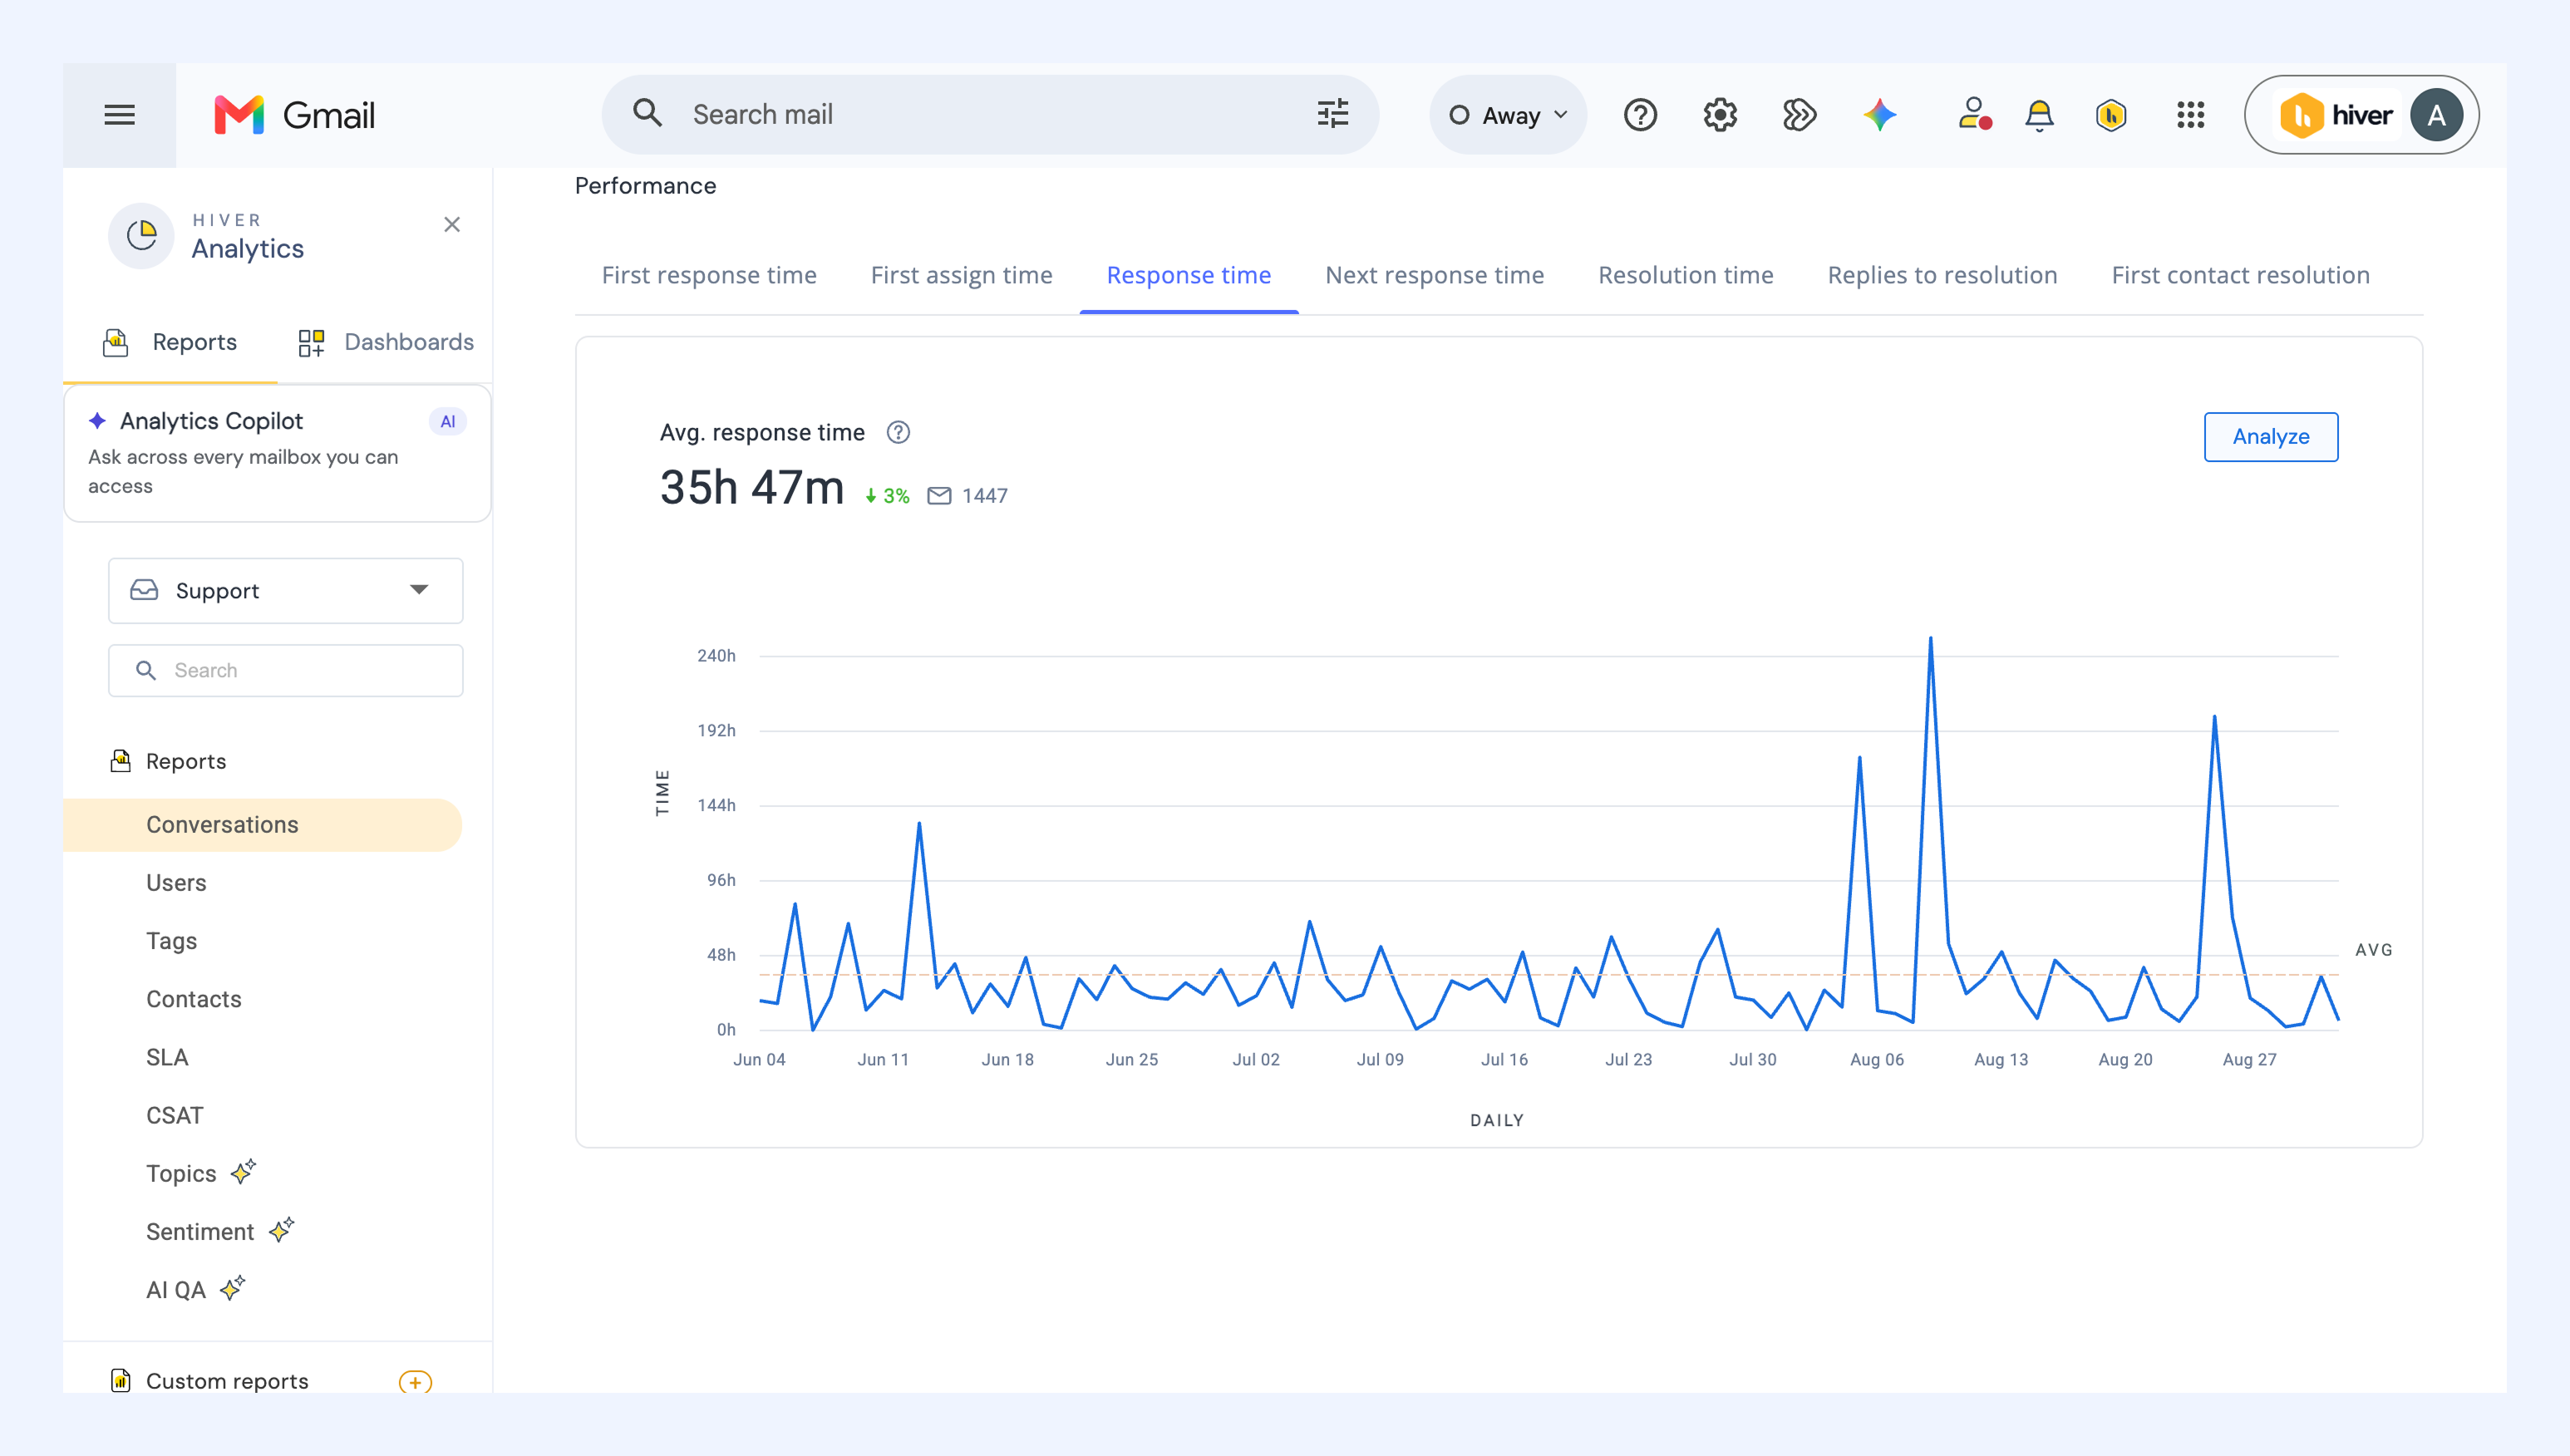
Response time
Shows how long your team takes to reply to emails in ongoing conversations. It includes all responses sent during the selected period, even if the conversation began earlier or was added later to the Shared Inbox.
Calculation
Average response time = Sum of all response times ÷ number of responses during the reporting period.
- For consecutive emails, the timer starts from the first unread message. For example, if emails arrive at 2 PM and 3 PM, and the team replies at 4 PM, the response time is 2 hours.
- For conversations added manually, timing begins when they’re added.
- If a conversation belongs to multiple Shared Inboxes, response time is tracked separately for each.
Explore the report
The report’s overview includes:
i) The average response time
ii) Percentage change in average response time compared to the previous timeframe of equal length
iii) Daily trend chart showing the response time
Drill down
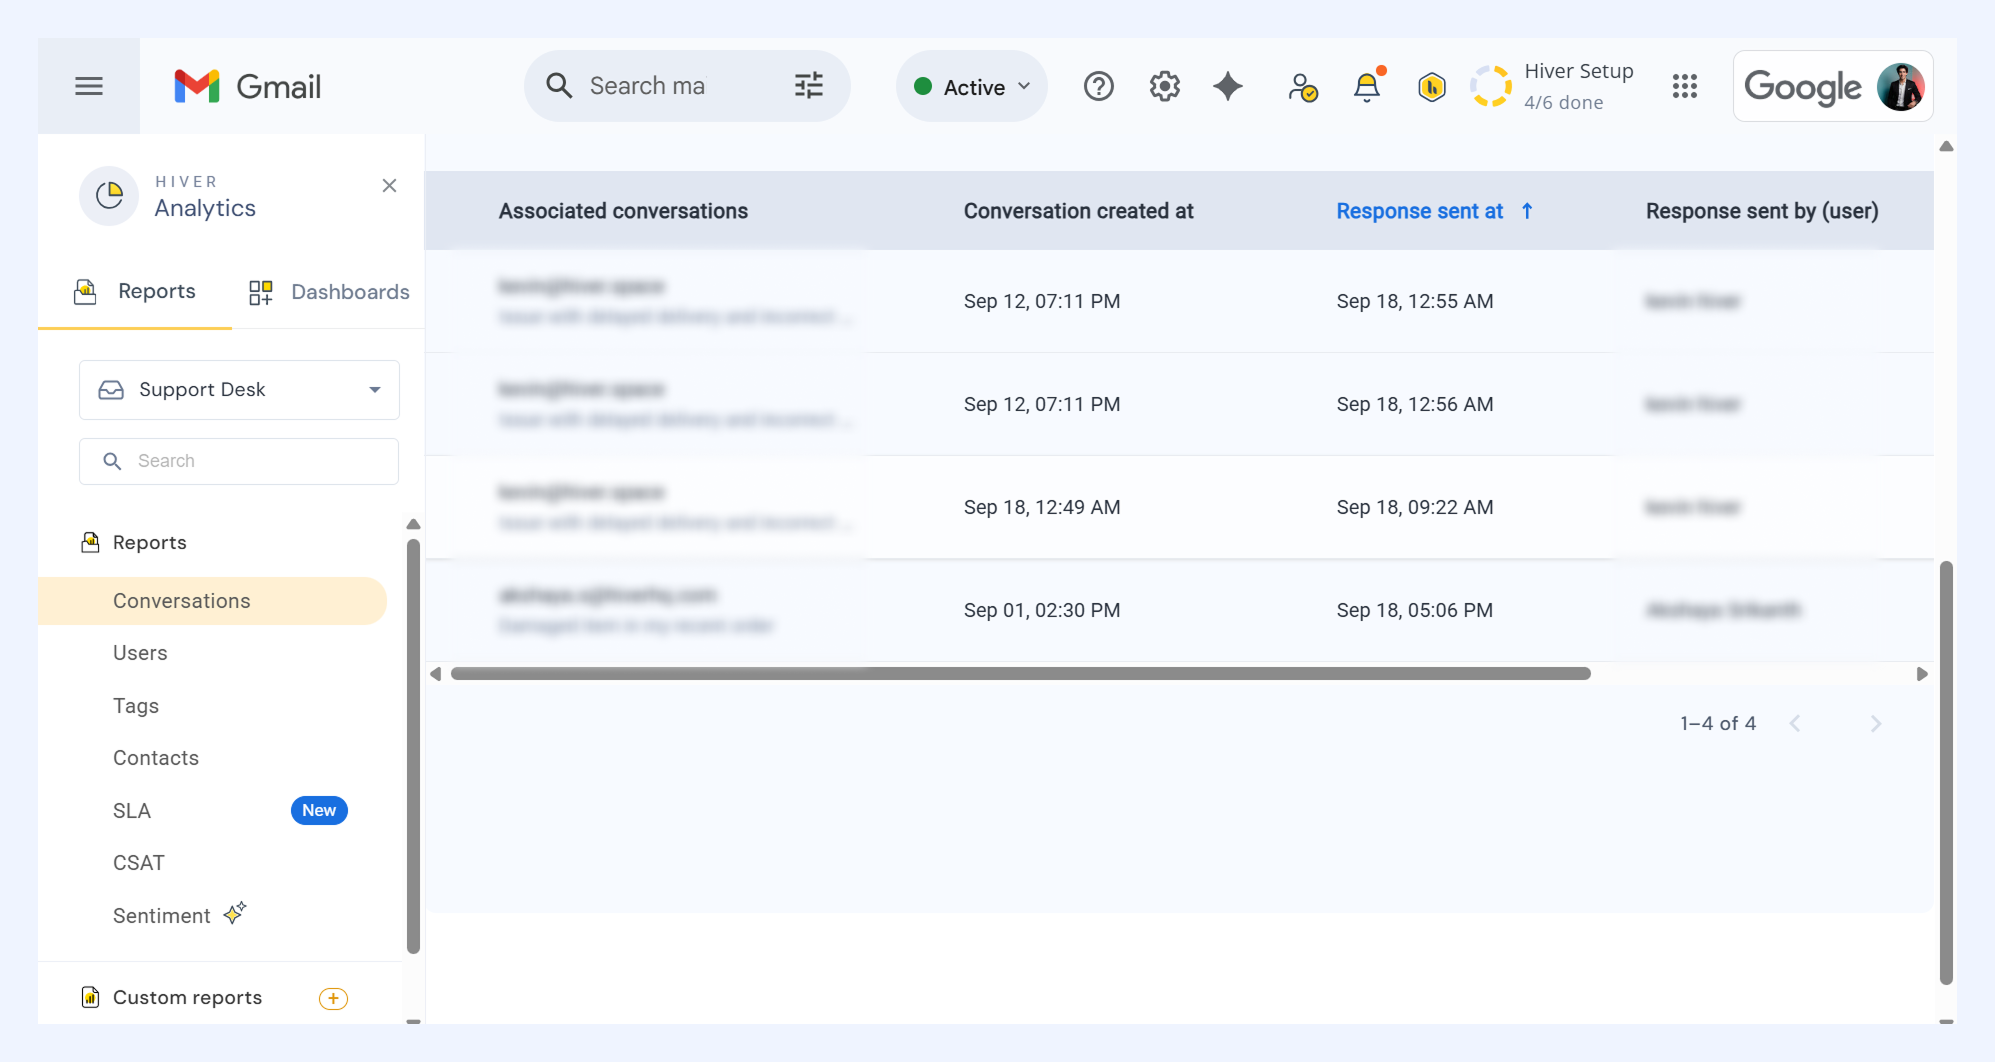
Click Analyze to go beyond the overview. You can:
- View all conversations in the report, including details such as conversation created at, response sent at, response sent by (user), response type, and response time.
Note: For new outbound emails (first email sent from the Shared Inbox), the response time is always:
- The first response data shows the time taken to reply to the first incoming email
- The next response data shows the time taken to reply to a follow-up customer email
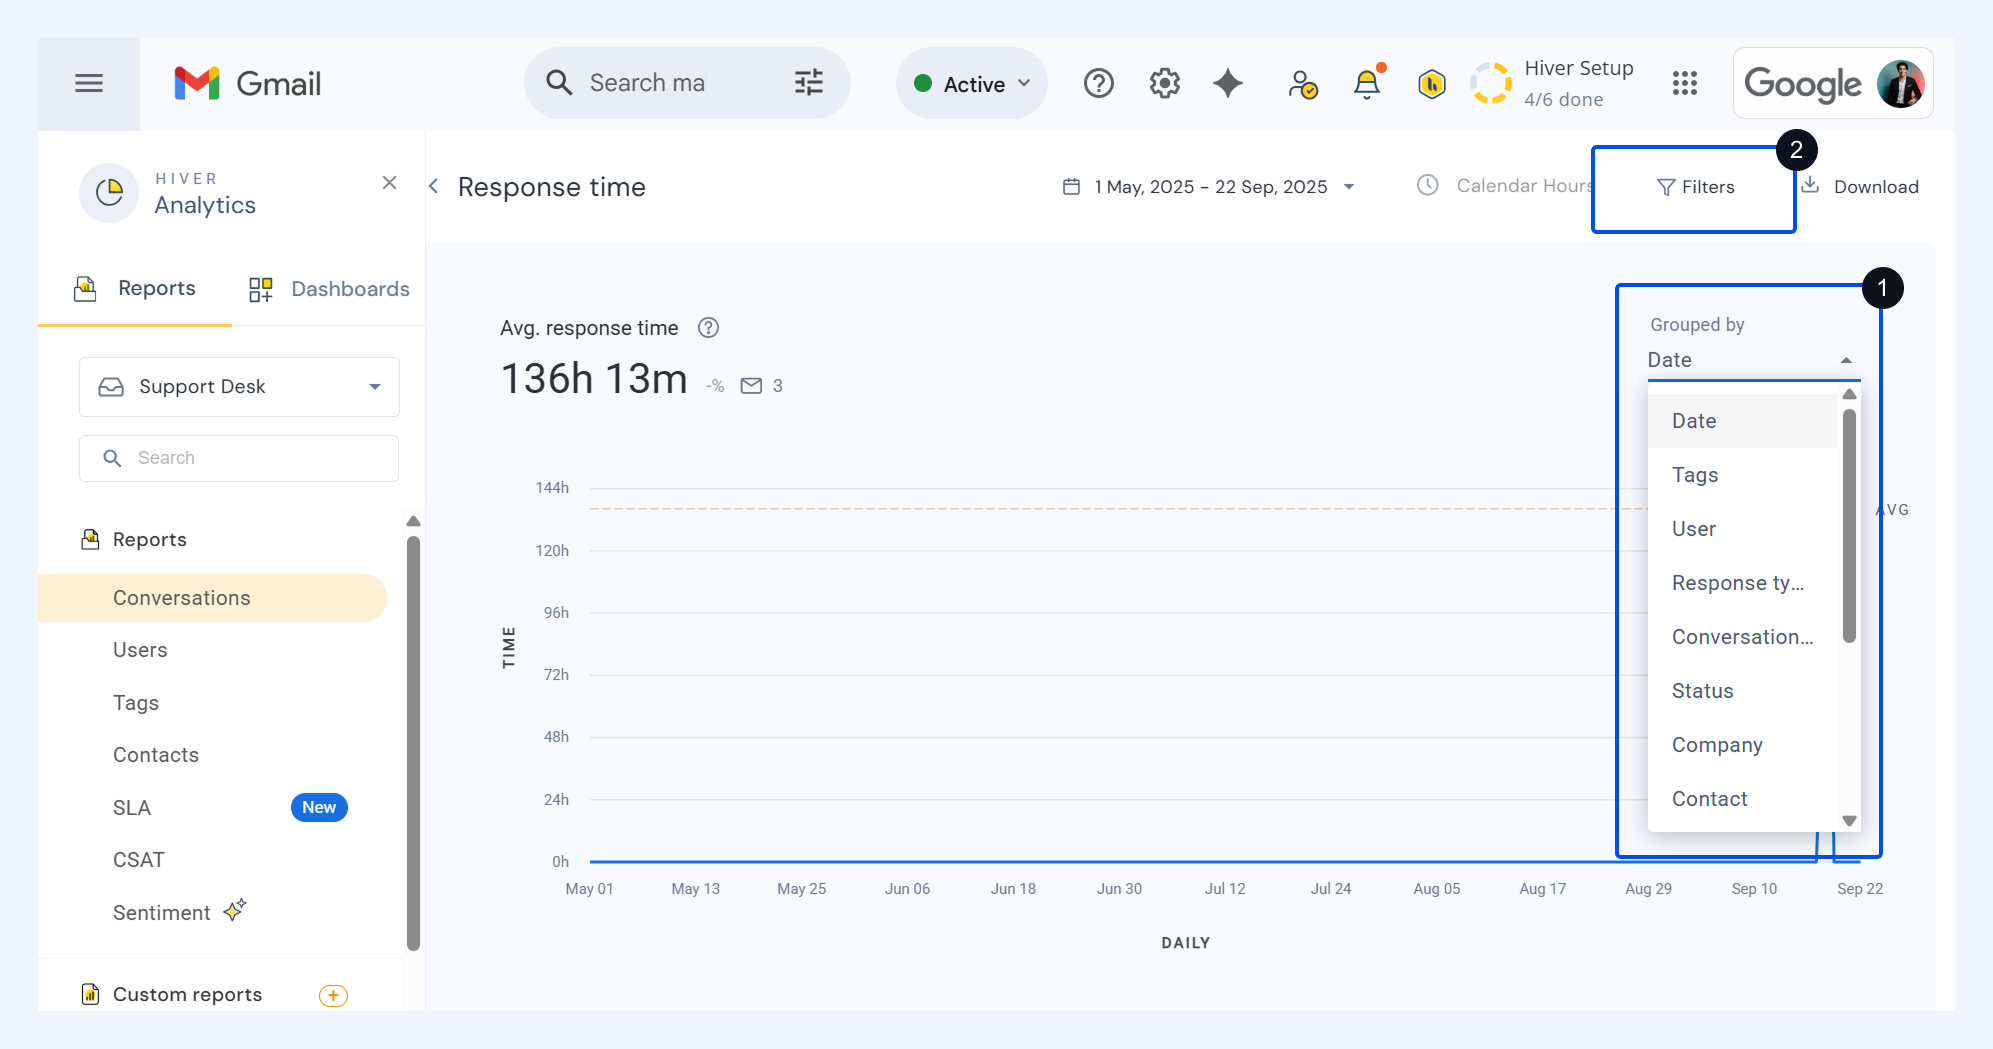
- Group data by date, tags, user, response type, conversation type, status, company, contact, or custom fields.
- Apply filters by status, sent by, tags, conversation type, response type, due date, priority, or custom fields.
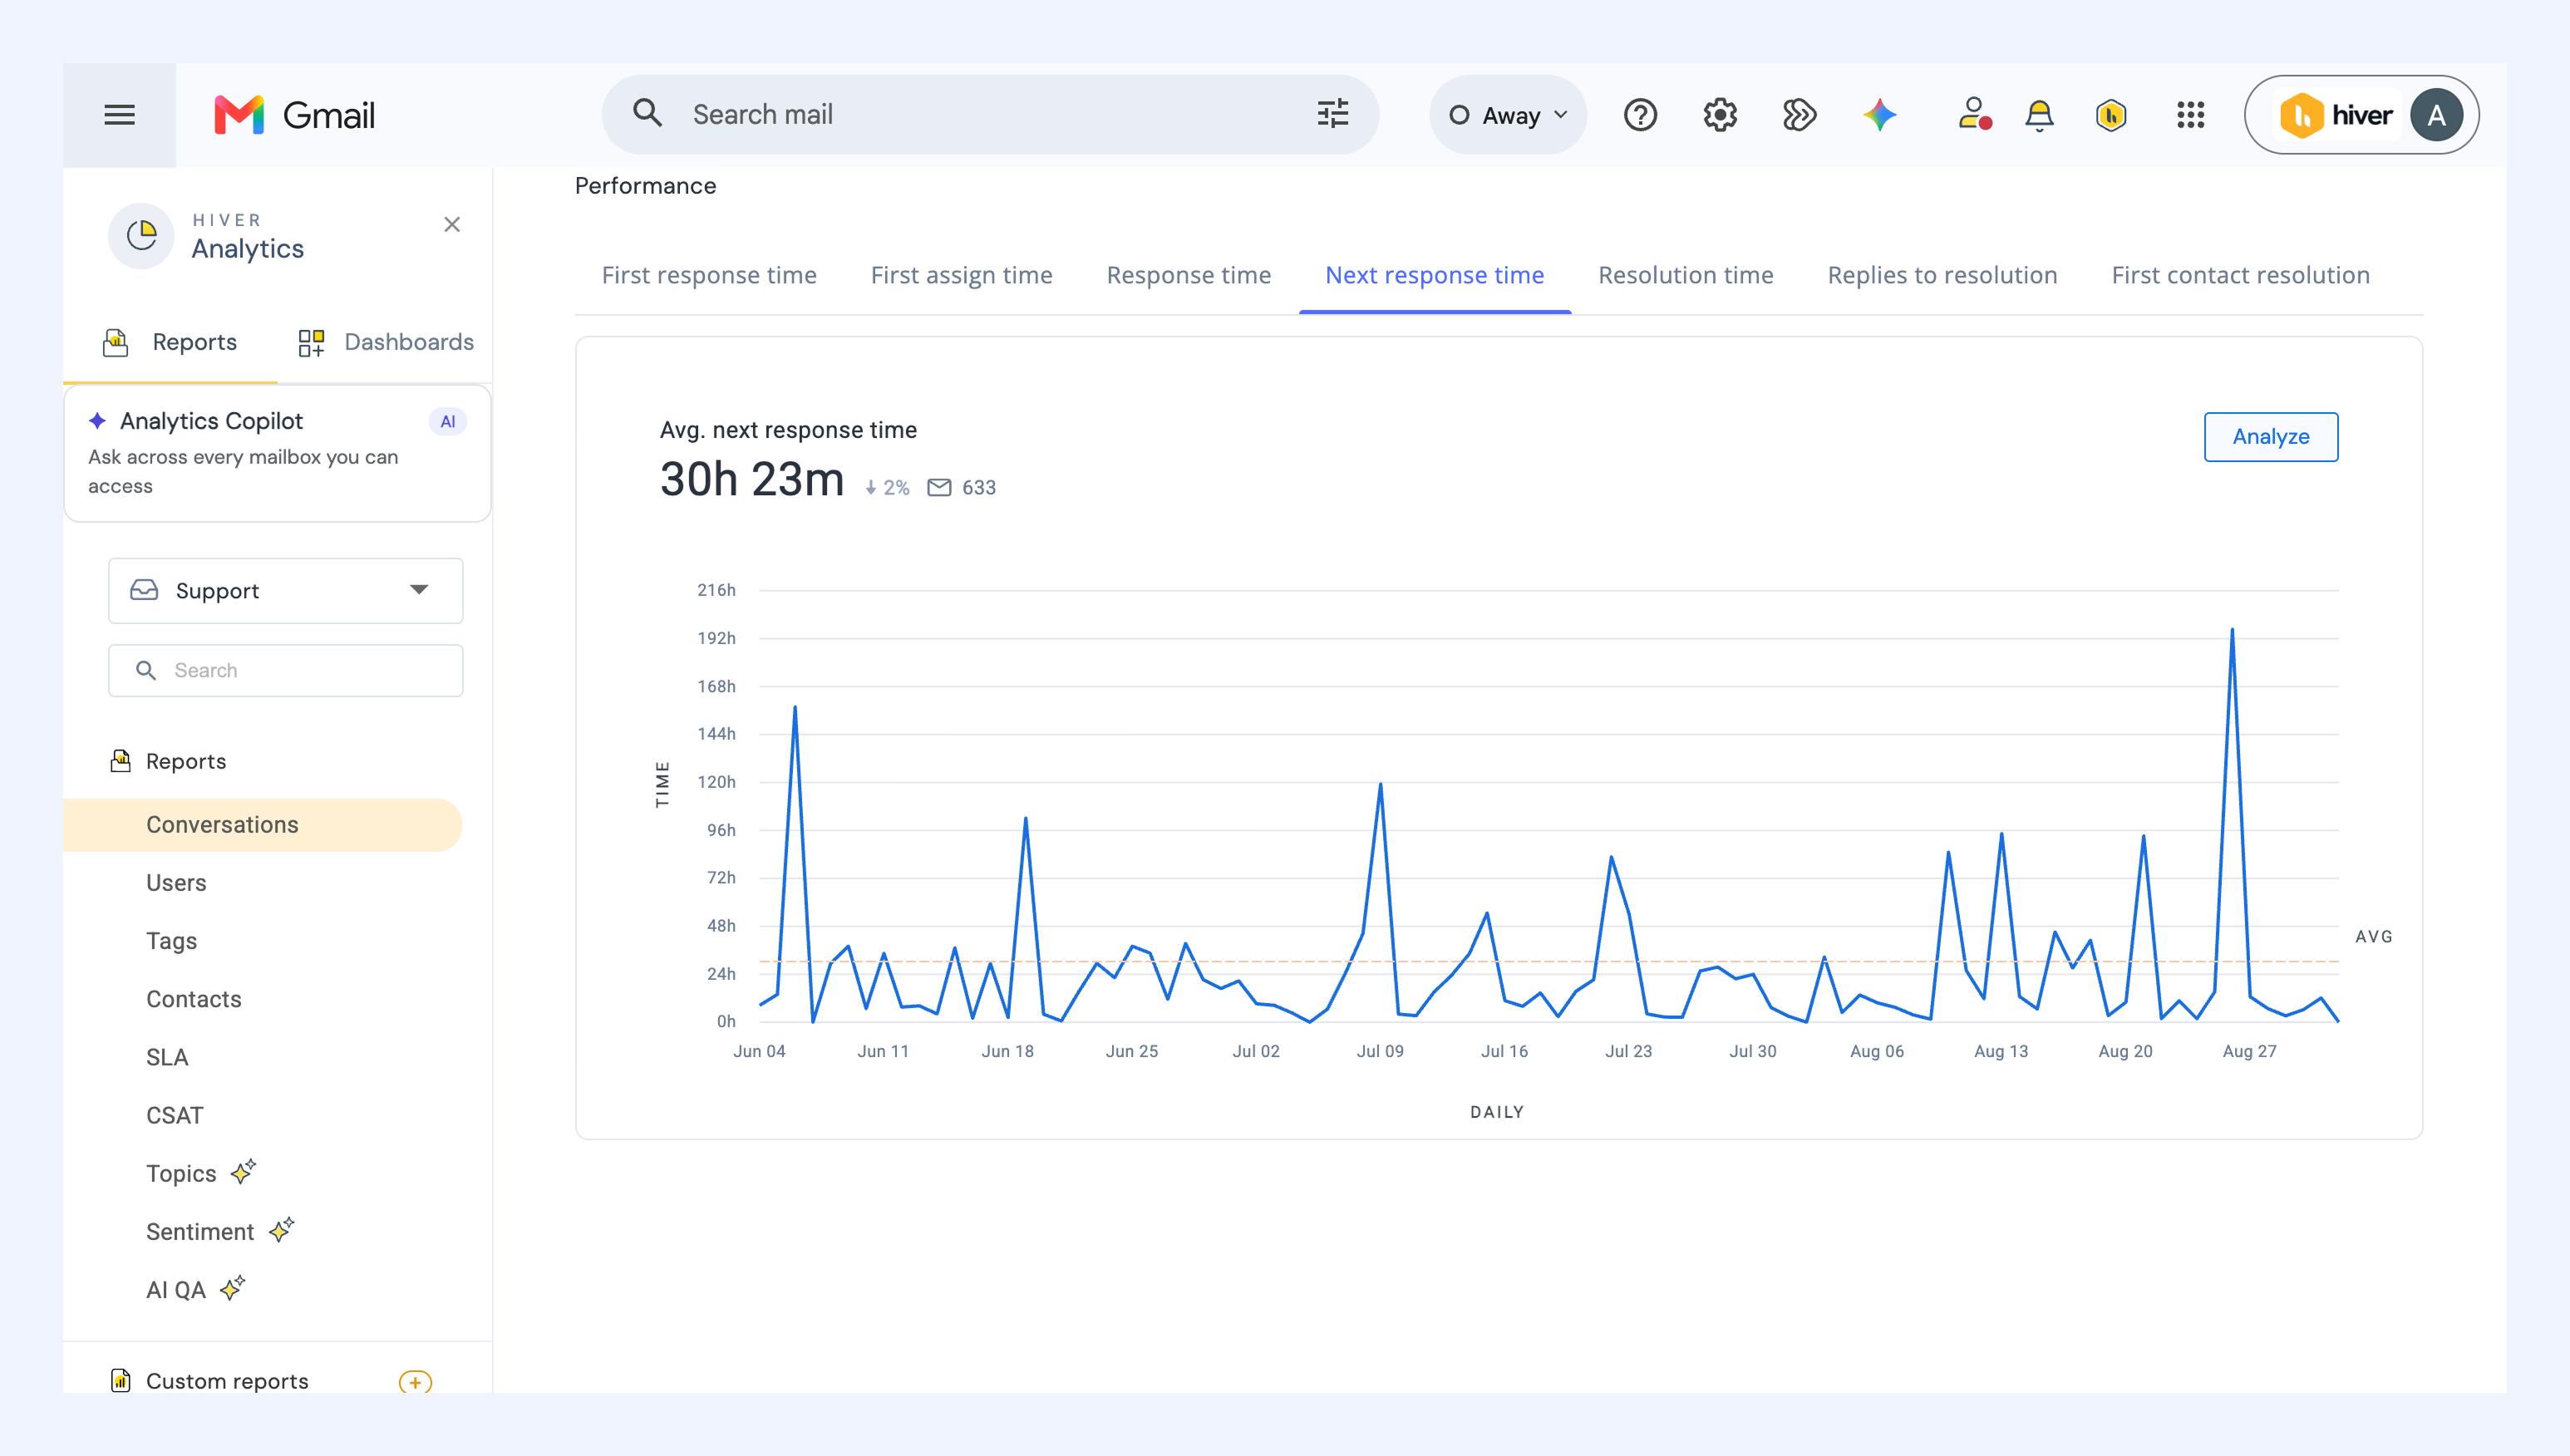
Next response time
Shows how long your team takes to reply to a customer's follow-up emails, once the first response has gone out. Read it alongside Response time to see whether conversations slow down after they are underway.
Calculation
Average next response time = Sum of all next response times ÷ number of next responses during the reporting period.
• For consecutive emails, the timer starts from the first unread message, not the customer's most recent one.
• Only replies sent after the first response count. The first reply in a conversation is measured under First response time.
• If a conversation belongs to multiple Shared Inboxes, next response time is tracked separately for each.
Explore the report
The report's overview includes:
i) The average next response time
ii) Percentage change in average next response time compared to the previous timeframe of equal length
iii) Daily trend chart showing the next response time
Drill down
Click Analyze to go beyond the overview. You can:
• View all conversations in the report, including details such as conversation created at, response sent at, response sent by (user), response type, and response time.
• Group data by date, tags, user, response type, conversation type, status, company, contact, or custom fields.
• Apply filters by status, sent by, tags, conversation type, response type, due date, priority, or custom fields.
Resolution time
Measures how long it takes for a conversation to be marked as Closed.
Calculation
Average resolution time = Total resolution time ÷ number of conversations closed during the period.
- If a conversation is present in multiple Shared Inboxes, resolution time is calculated separately for each.
- With Business Hours enabled, only time spent in Open during working hours is factored into the calculation.
- With Calendar Hours, the total open time is calculated regardless of work hours.
Explore the report
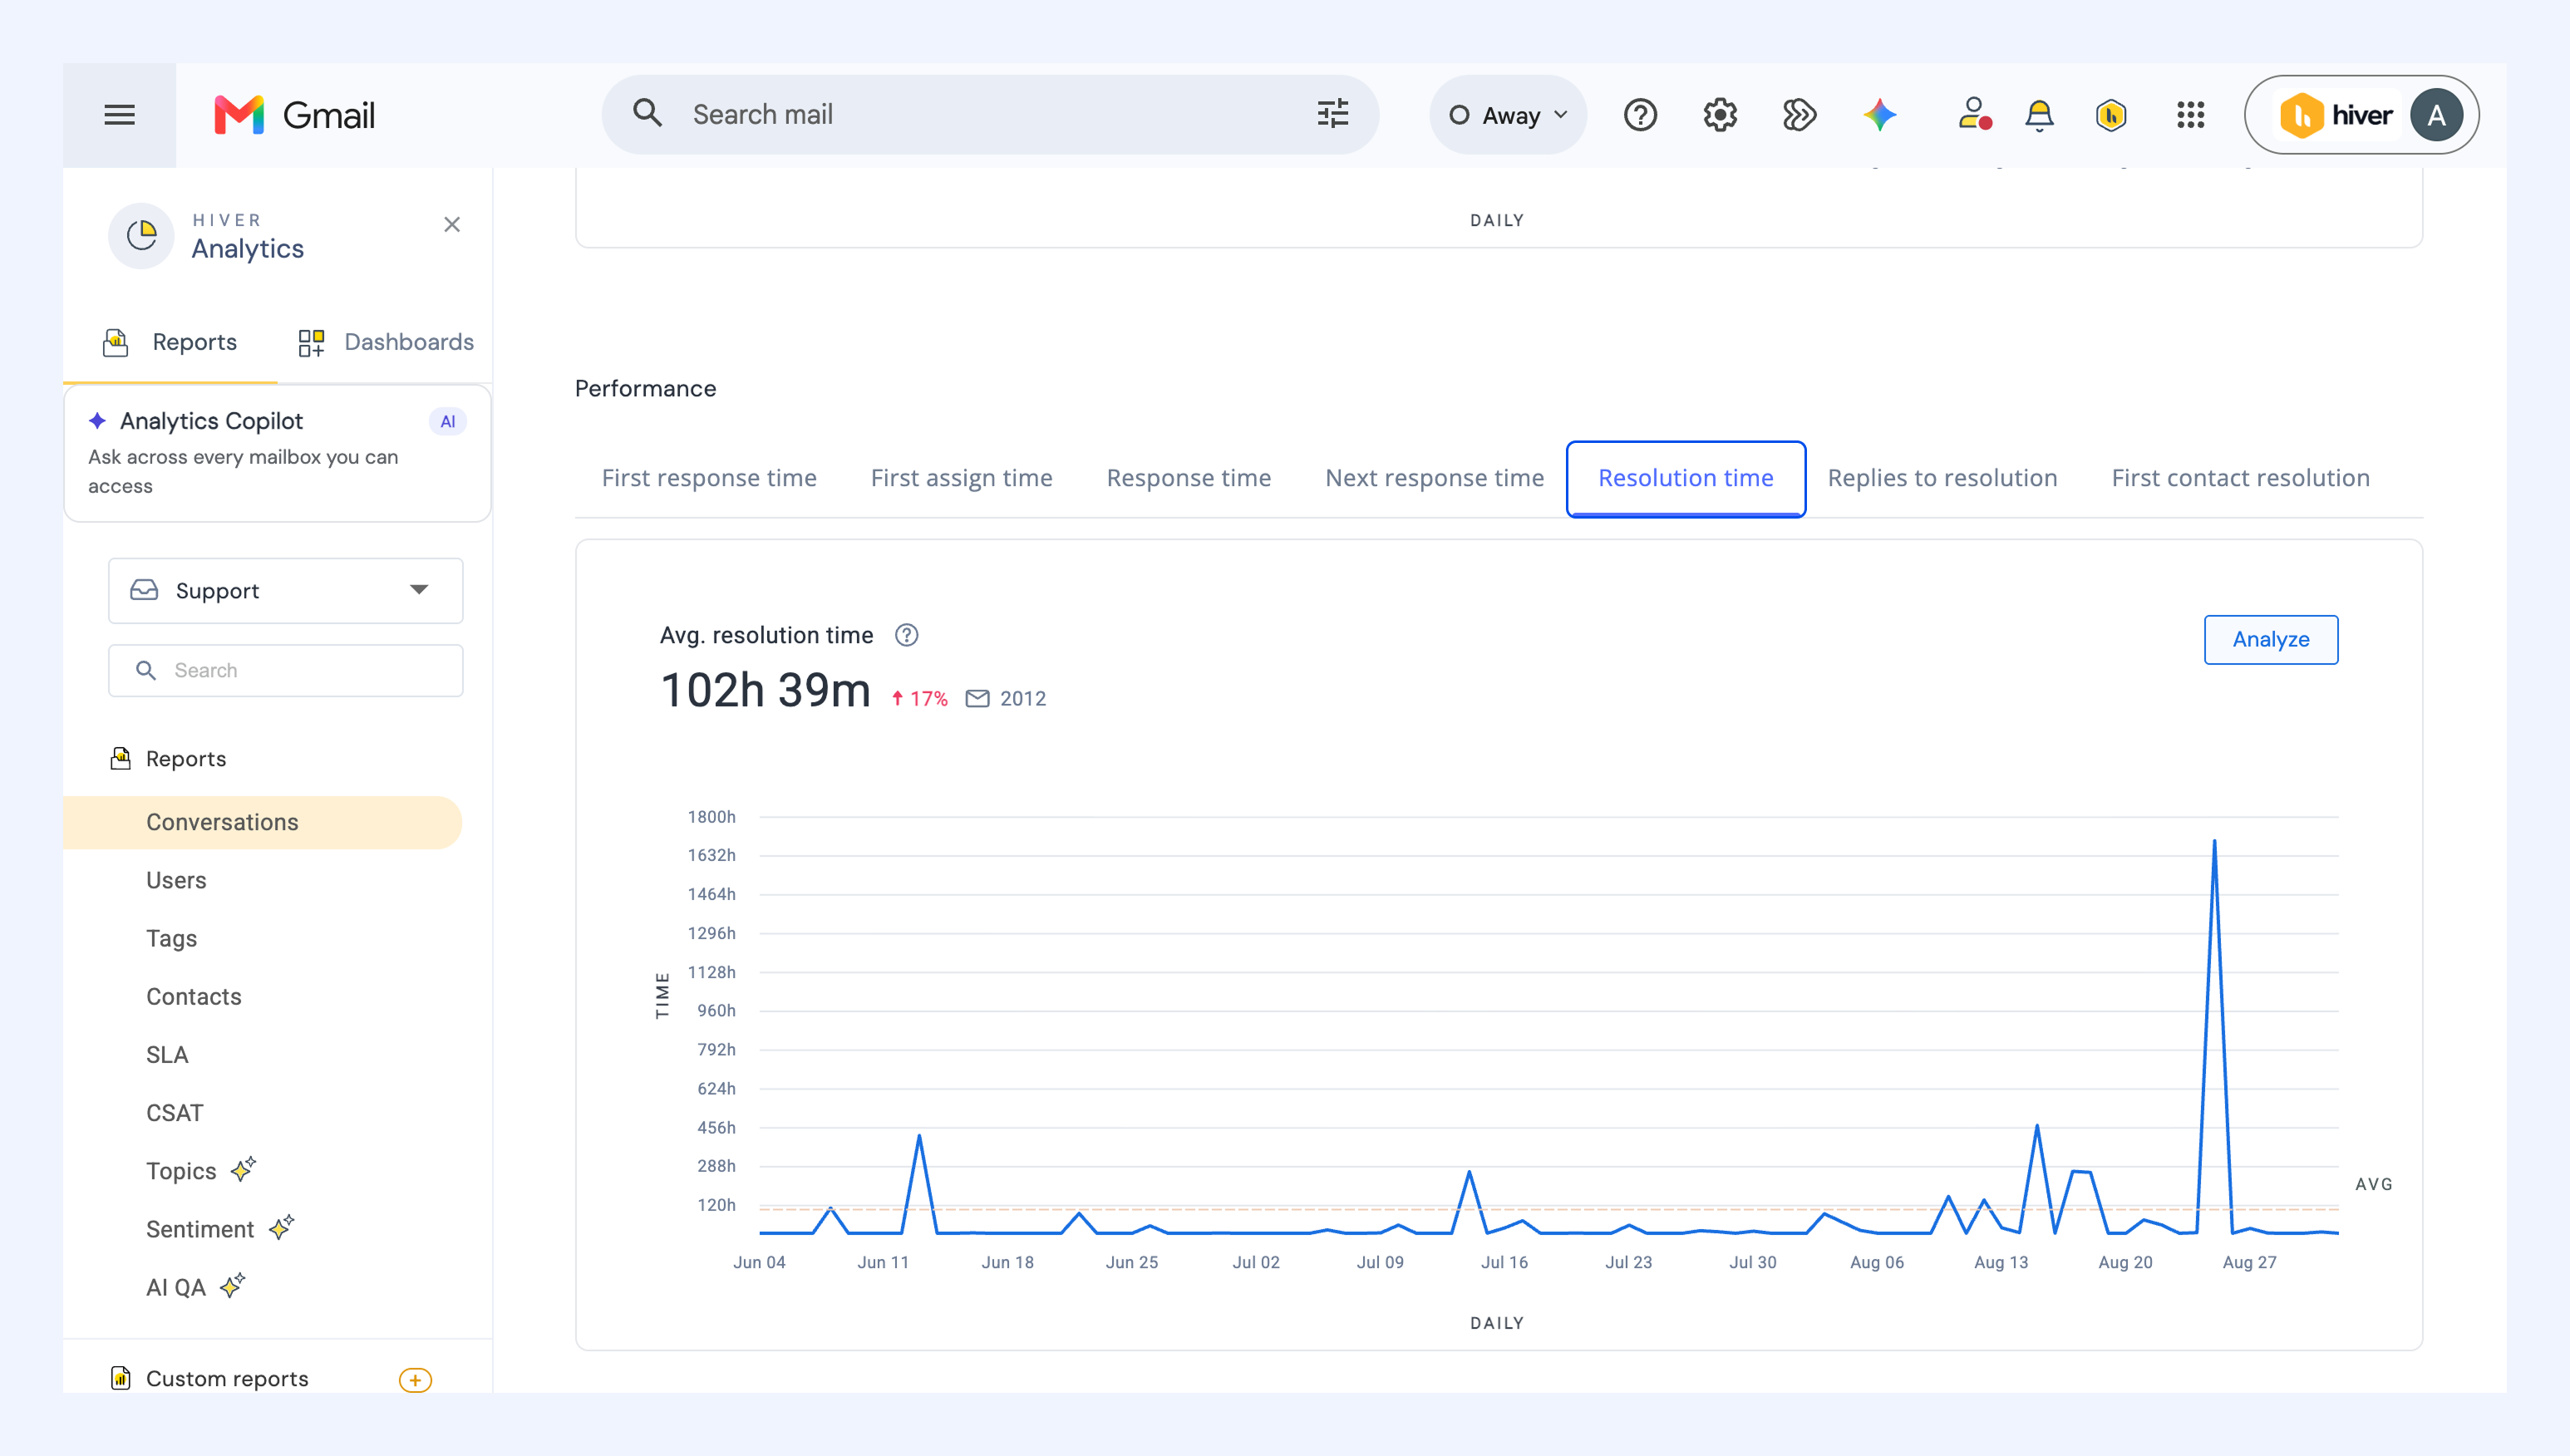
The report’s overview includes:
i) The average resolution time
ii) Percentage change in average resolution time in comparison to the previous timeframe of equal length
iii) Daily trend chart showing the average resolution time
Drill down
Click Analyze to go beyond the overview. You can:
- View all conversations in the report, including details such as created at, resolved at, emails from inbox, and resolution time.