Reporting and analytics overview
Hiver’s Analytics gives you a clear view of your team’s email activity. You’ll see trends in email volume, monitor how your team is responding, and find areas where workflows can improve. Each report offers an overview and performance of key metrics and lets you dig into the details when needed.
Accessing Analytics in Hiver Omni
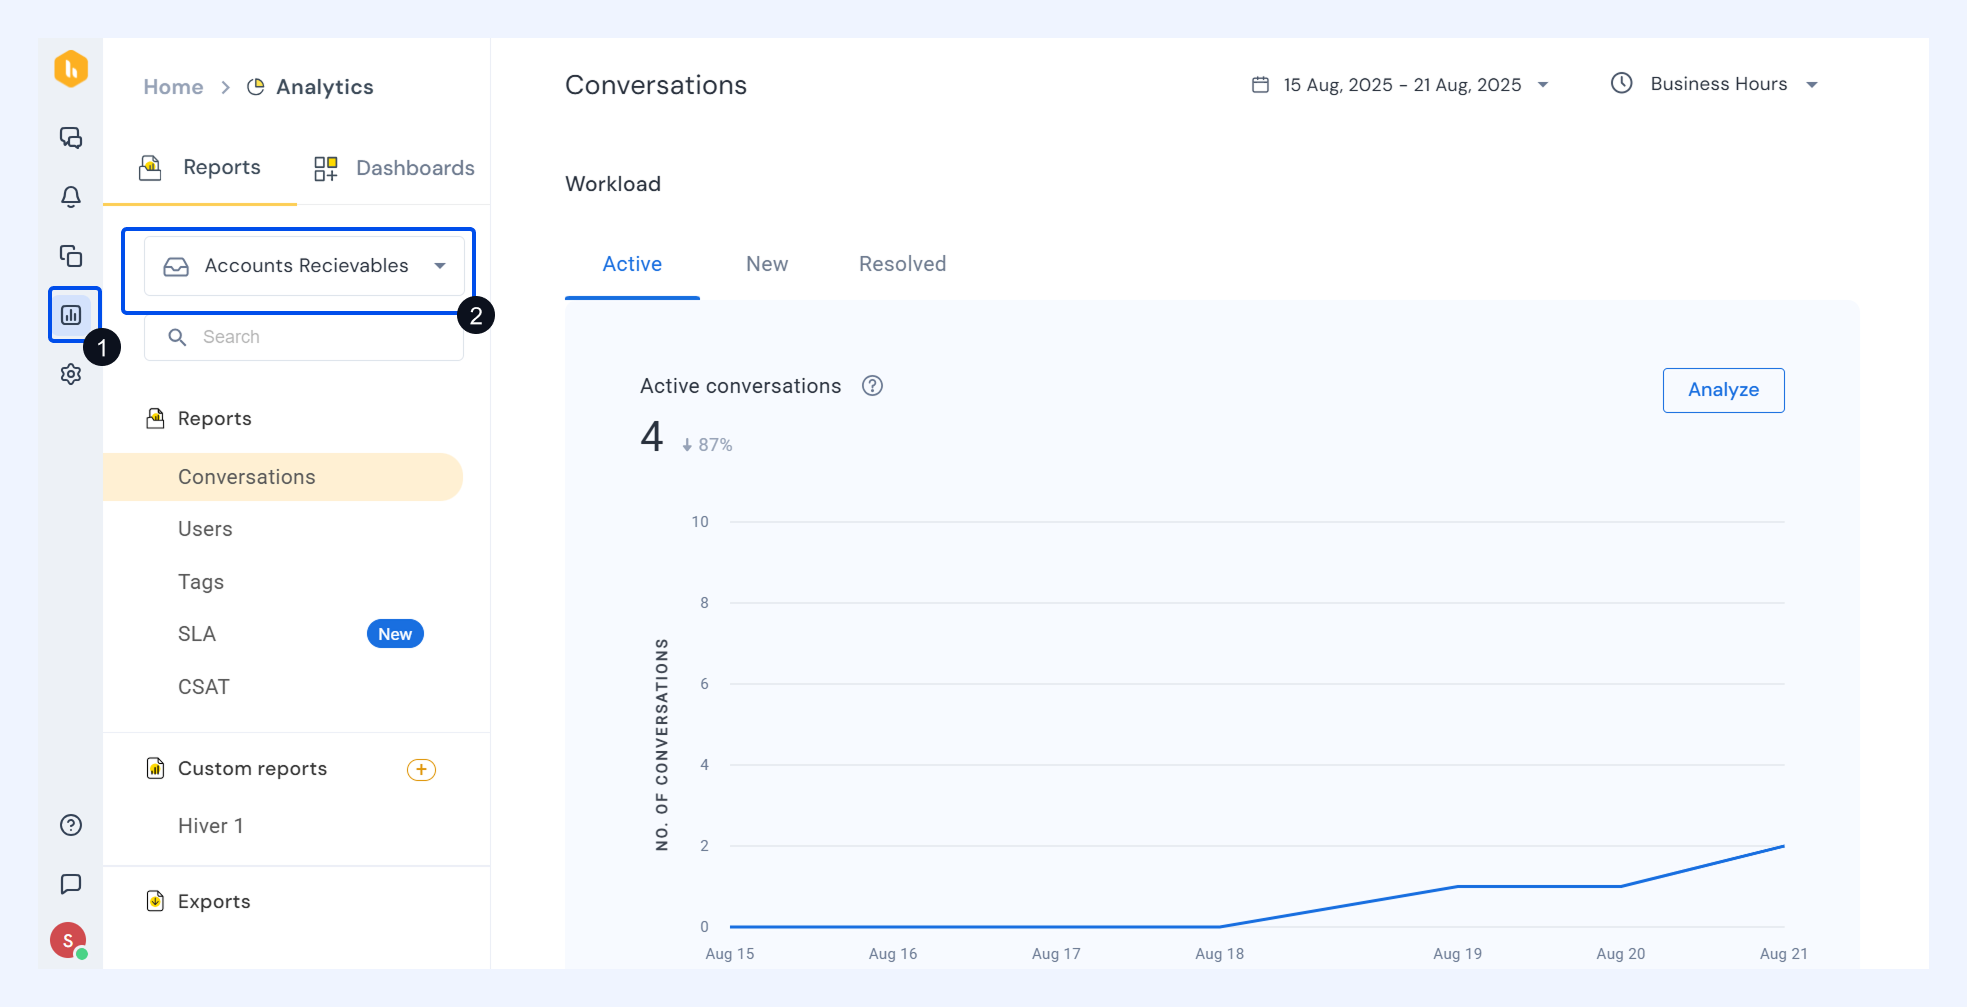
You can access Analytics directly from the left panel in Outlook.
Note: All reports in Hiver are tied to individual Shared Inboxes, so every metric you see is specific to that inbox. To view reports, simply select the Shared Inbox you want to analyze.
Availability by plan
Plan | Reports available | Reporting window | Exports |
Growth | Not available | Not available | Not available |
Pro | Conversations, Users, Tags, CSAT | 6-month limit | Basic and scheduled exports |
Elite | Conversations, Users, Tags, CSAT, Custom reports | 6-month limit | Basic and scheduled exports |
Understanding tabs in Reports
All reports in Hiver are generated for a specific time range. Use the date picker at the top of the Analytics page to choose the period you want to analyze.
You’ll see five default reports in every Shared Inbox:
- Conversations: Track how many conversations your team handled, along with how quickly and effectively they responded.
- Users: Get performance insights at an individual level, see what each team member worked on, and how they contributed.
- Tags: Measure conversation volume and response quality across different categories using tags.
- SLA: Monitor how your team is meeting service level agreements. This report highlights missed SLAs and helps you identify patterns behind delays.
- CSAT: Review customer satisfaction scores and feedback trends to understand how well your team is supporting users.
Custom reports
Custom reports help you get granular, personalized insights from Hiver Analytics. Instead of reapplying filters every time, you can create and save pre-filtered reports on top of default metrics.
Custom reports let you:
- Get faster access to the metrics and filters that matter most.
- Save and name reports for quick reuse.
- Edit, rename, or delete reports as your needs change.
This makes it easier to track performance trends, monitor specific workflows, and share consistent insights across your team.
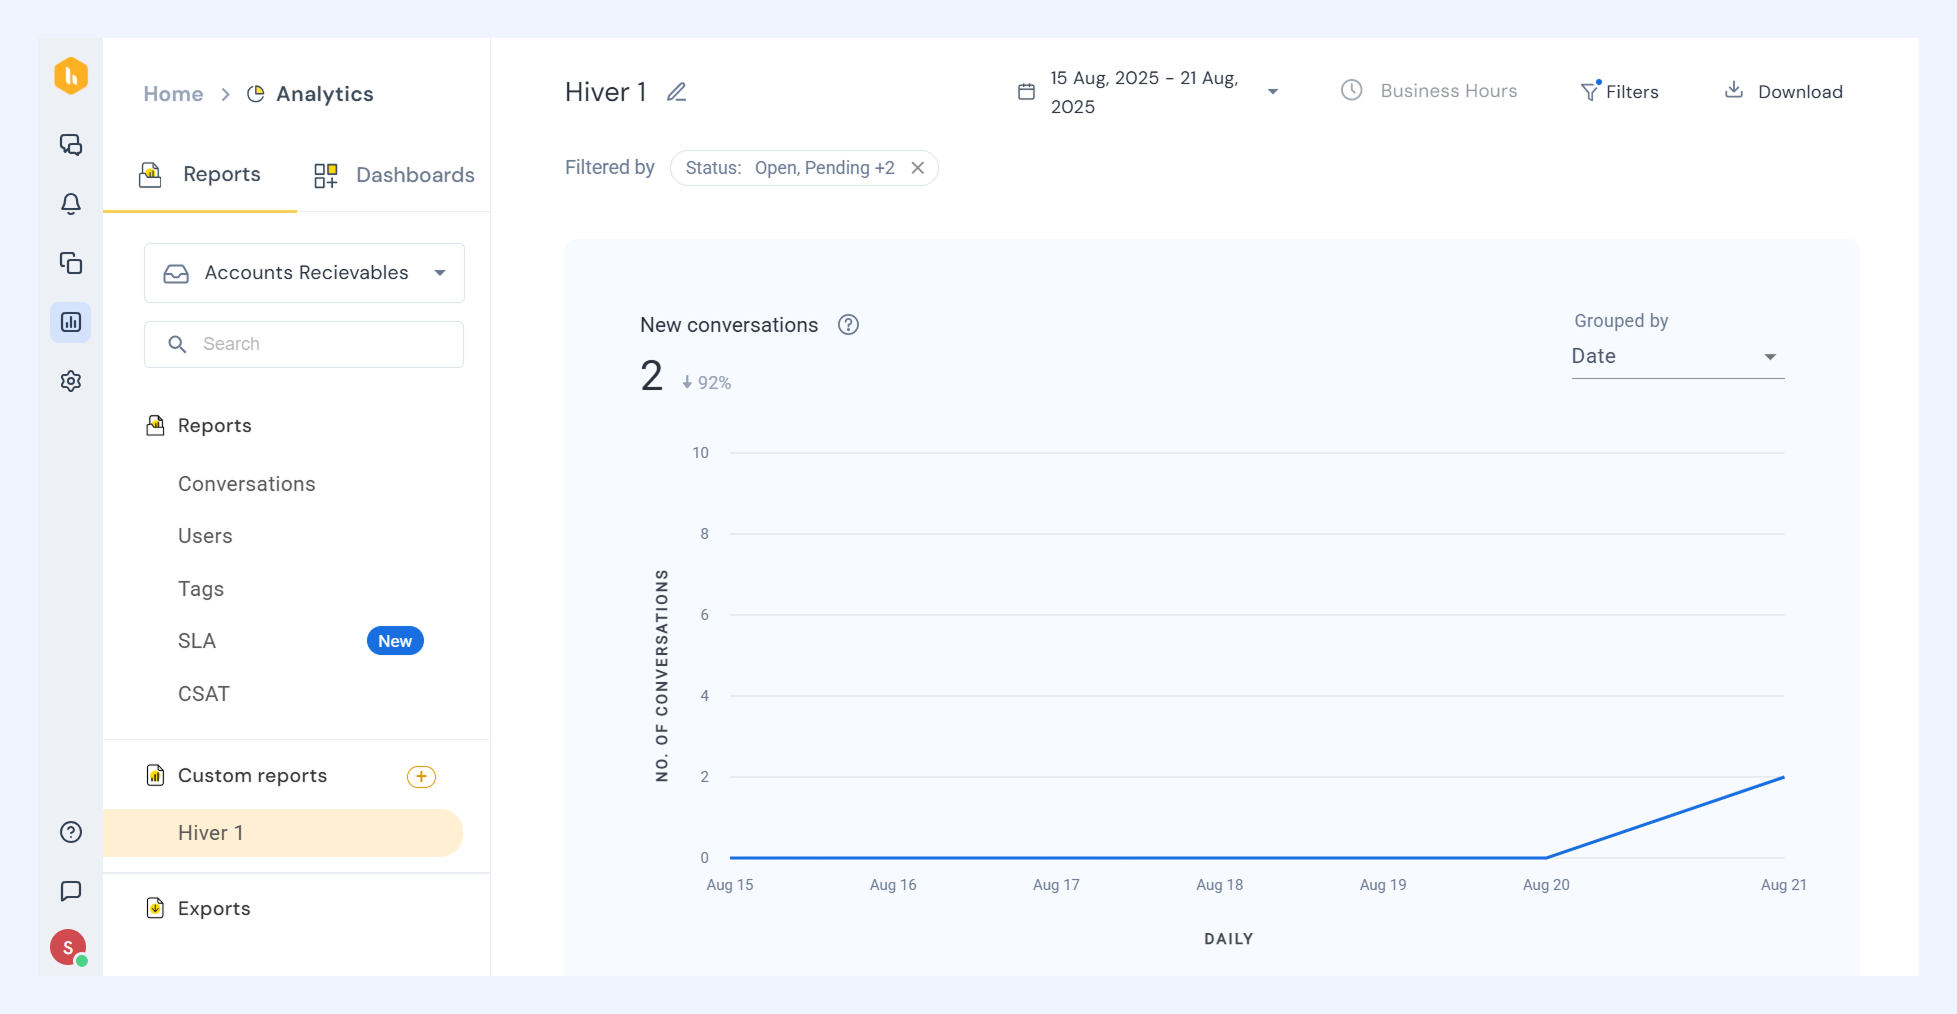
You can create a custom report in two ways:
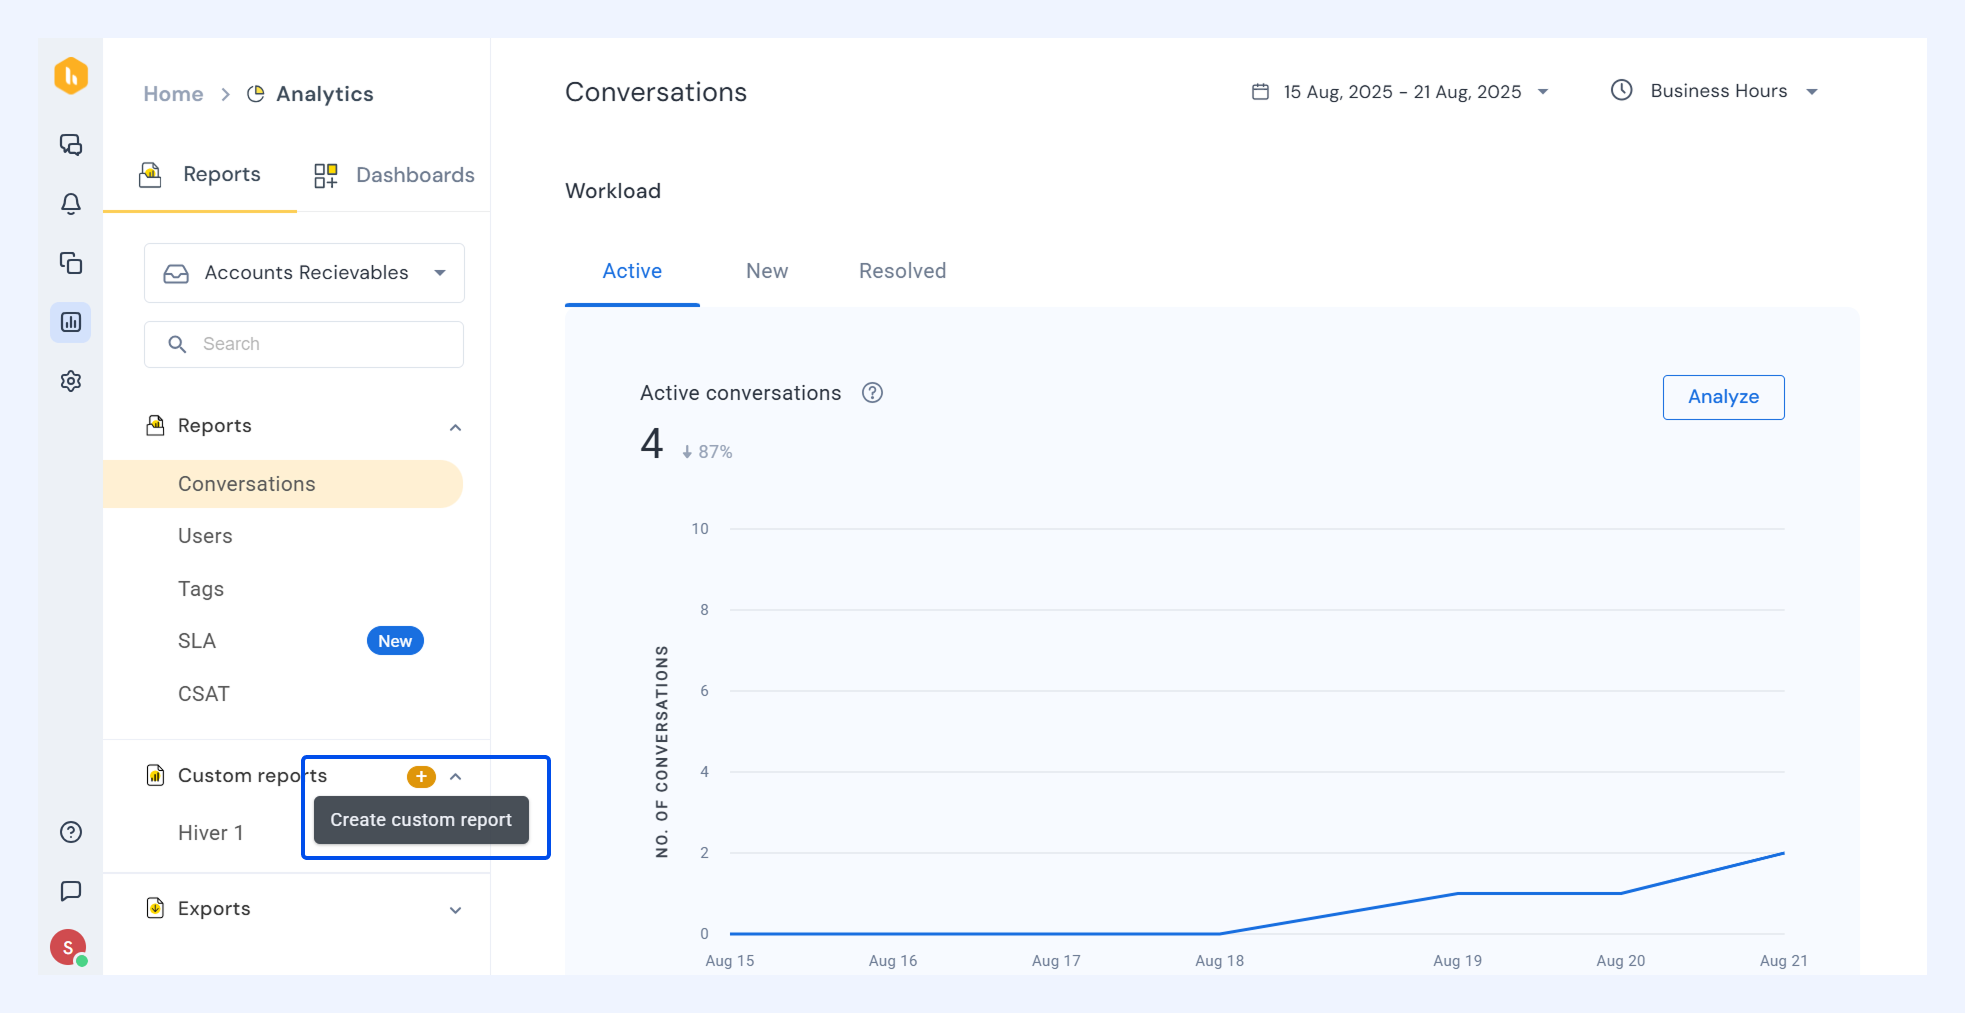
1. From scratch: Click the + icon next to Custom reports in the Reports panel.
2. From a default metric: Apply filters to an existing report and save it.
Method 1: From scratch
1. Go to Analytics in the left panel and click the + icon next to Custom reports.
2. Choose a metric (e.g., Resolved conversations) from the dropdown. Add parameters such as Assignees or Tags (e.g., Tag: Important).
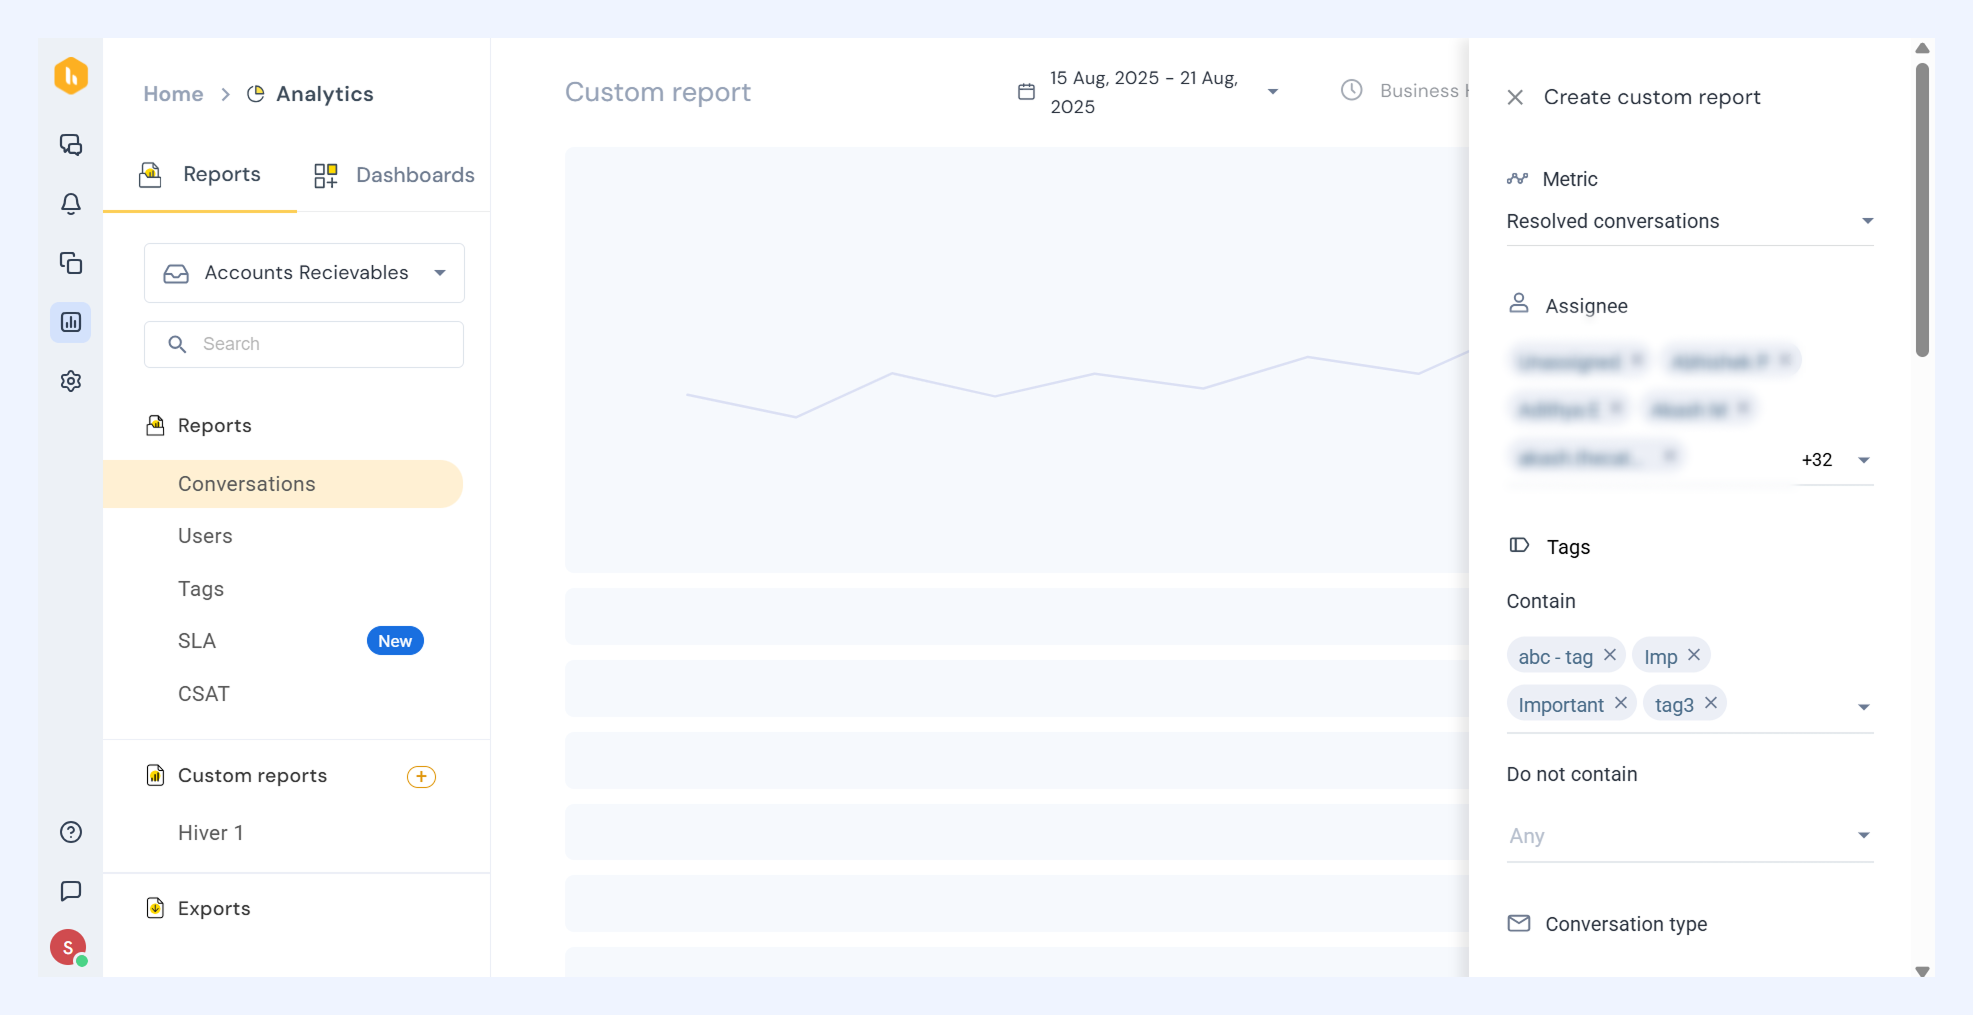
3. Click Preview, and after finalizing your preview, select Save as Custom Report. Enter a name and hit Save.
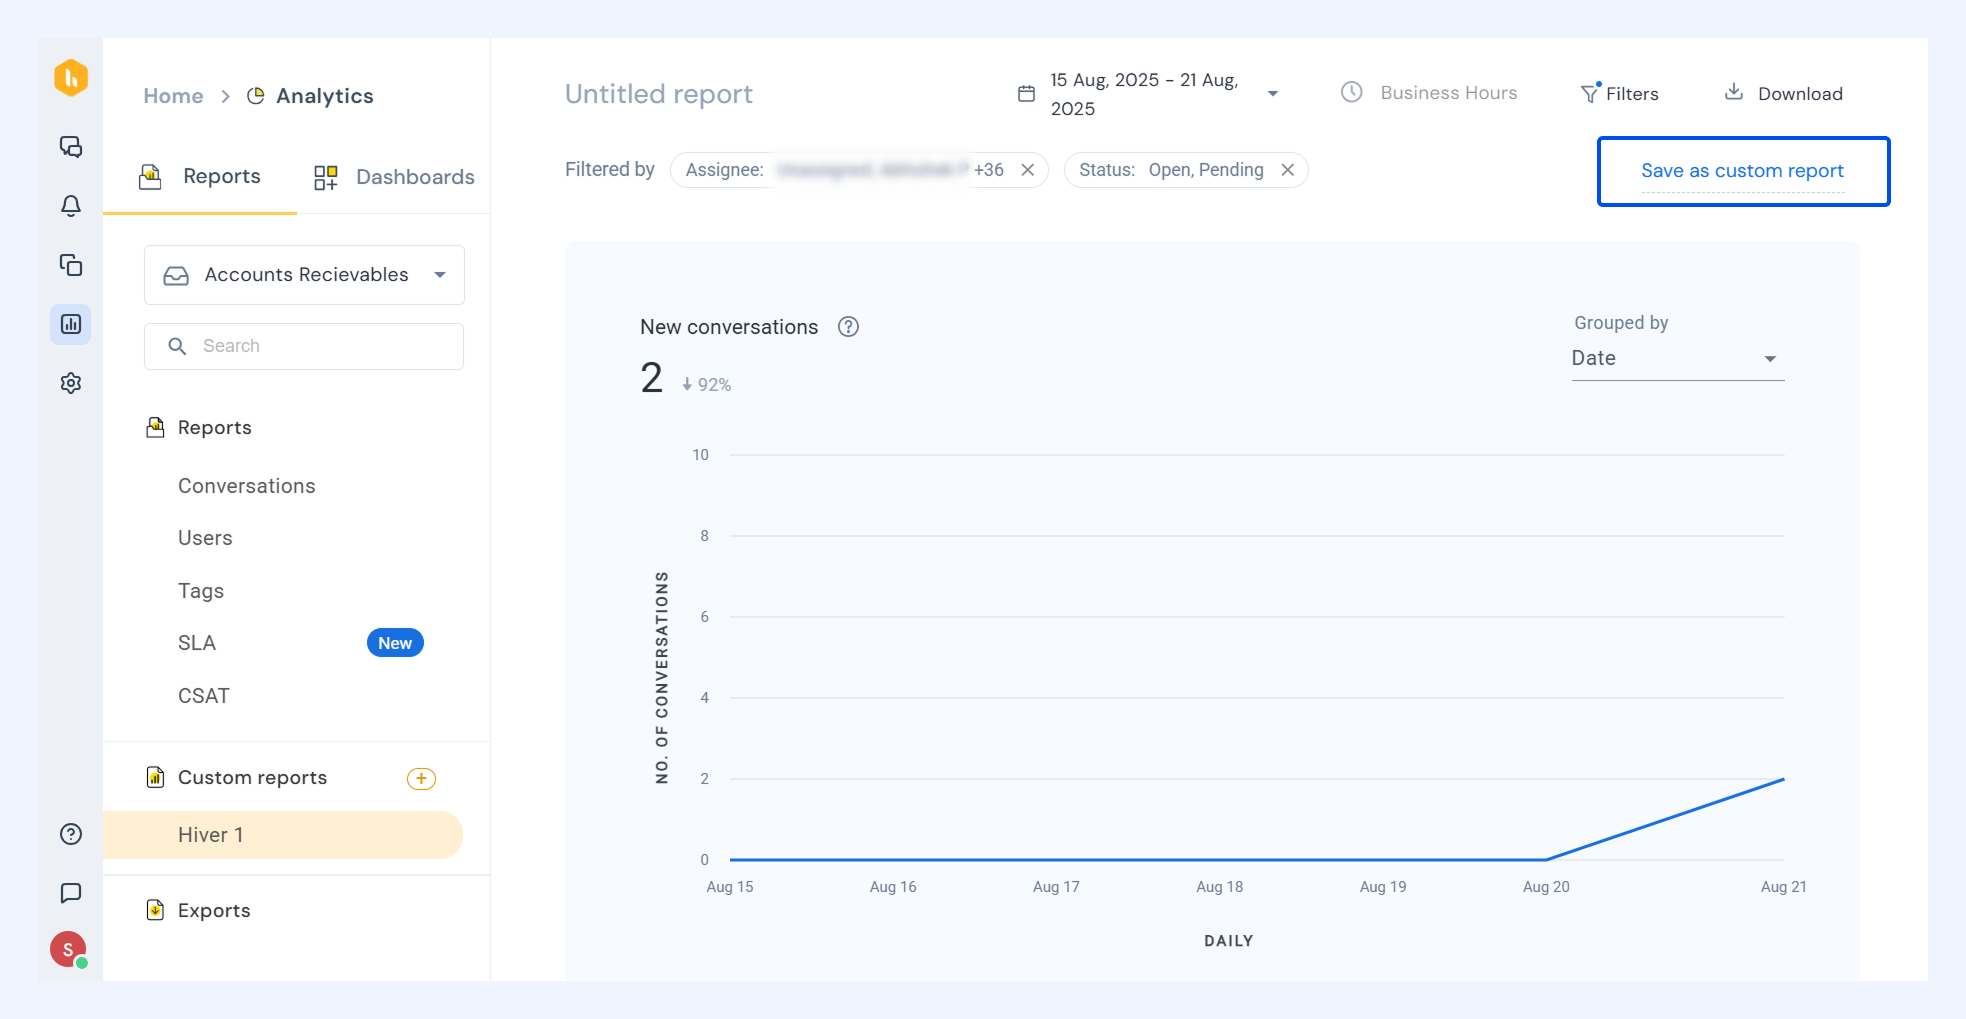
Your report will now appear in the Custom reports section of the left panel.
Method 2: From a default metric
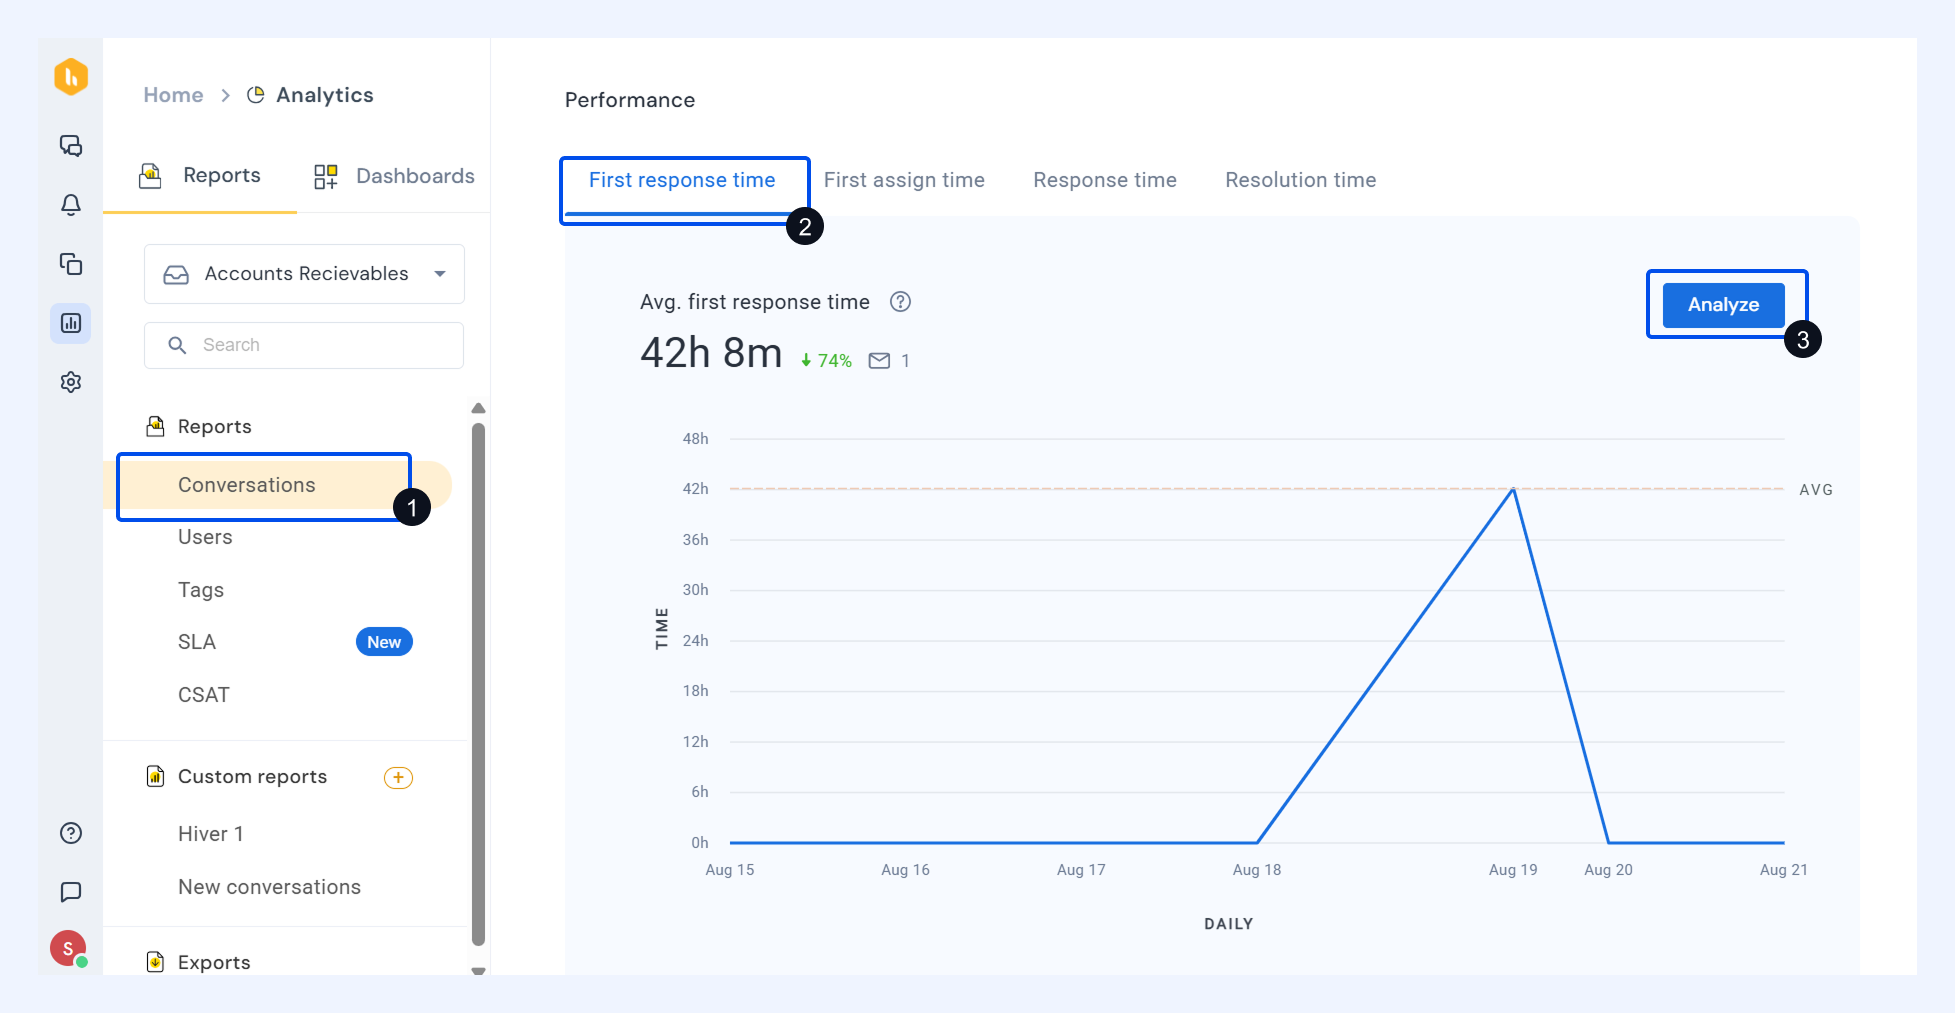
1. Open a default report (e.g., Conversations → First response time), and click Analyze.
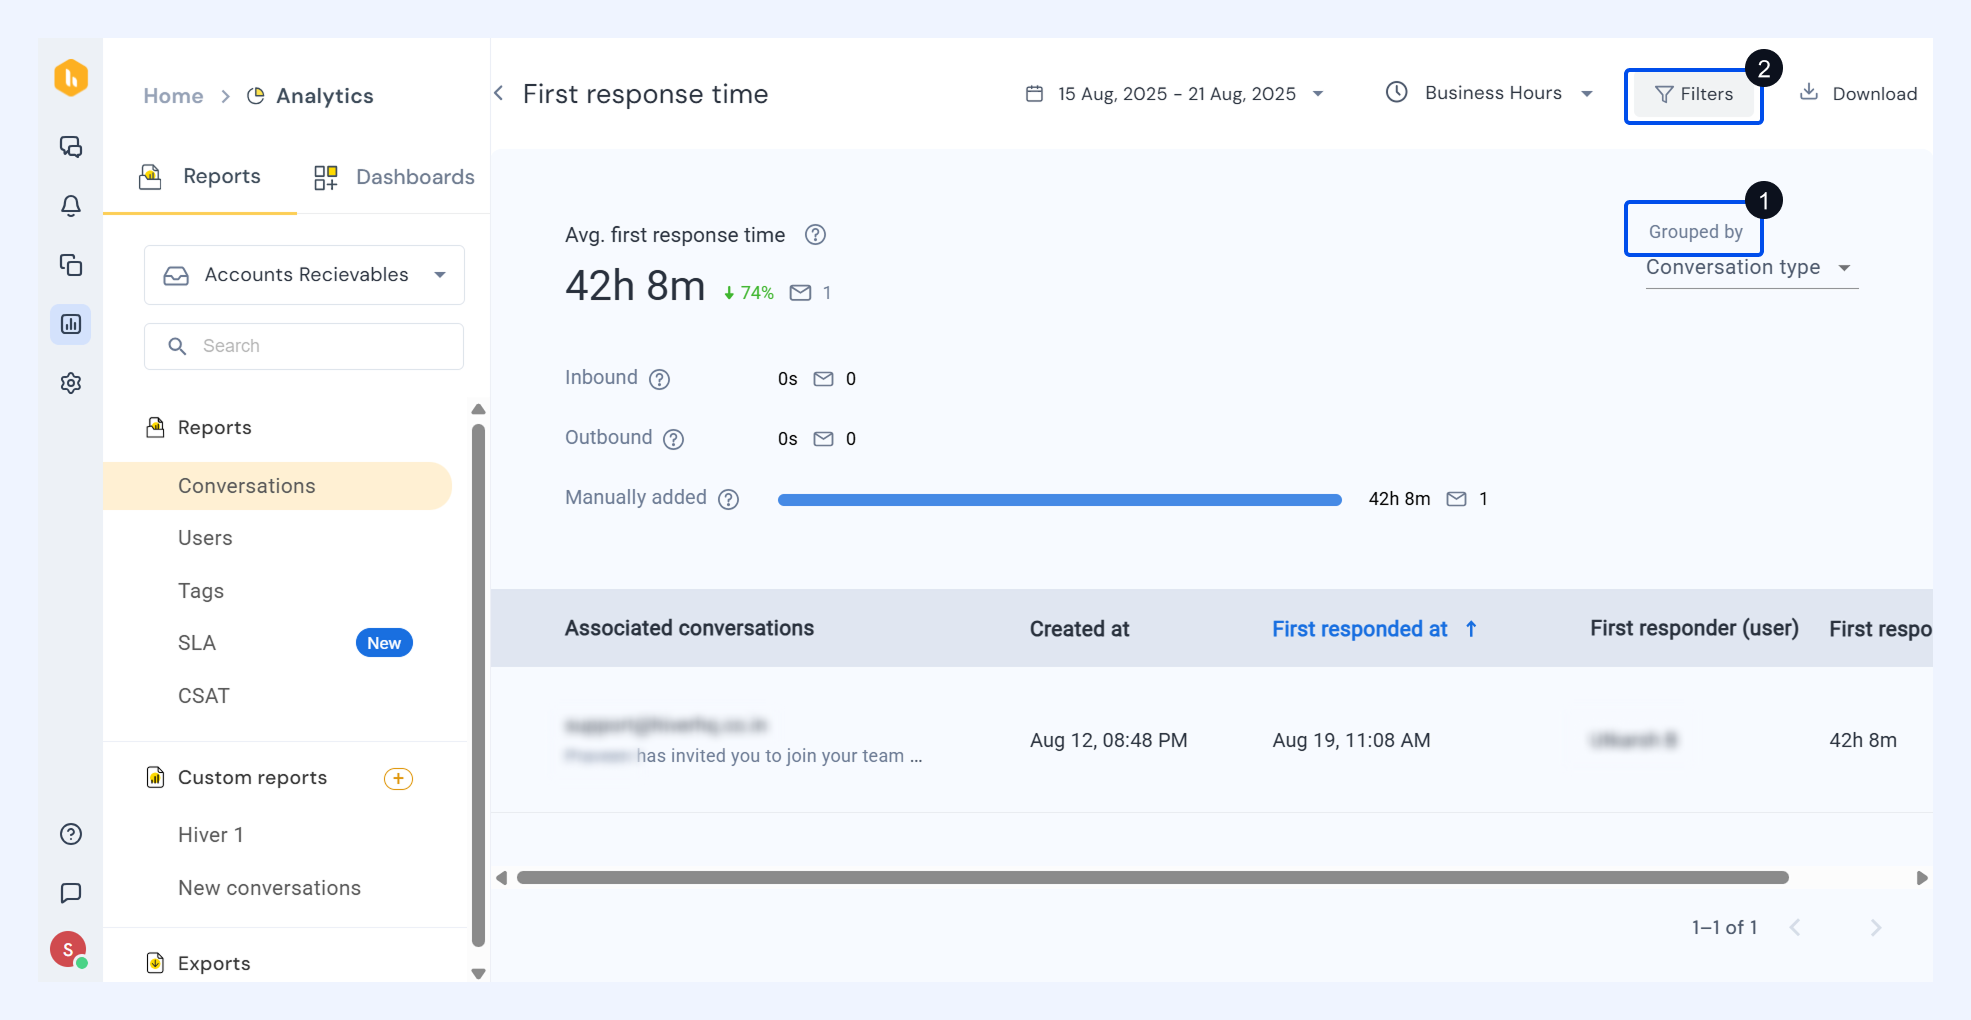
2. Use the dropdown to group data (e.g., by Conversation types). Click Filters and select the parameters you want (e.g., Tags, Assignees, Status).
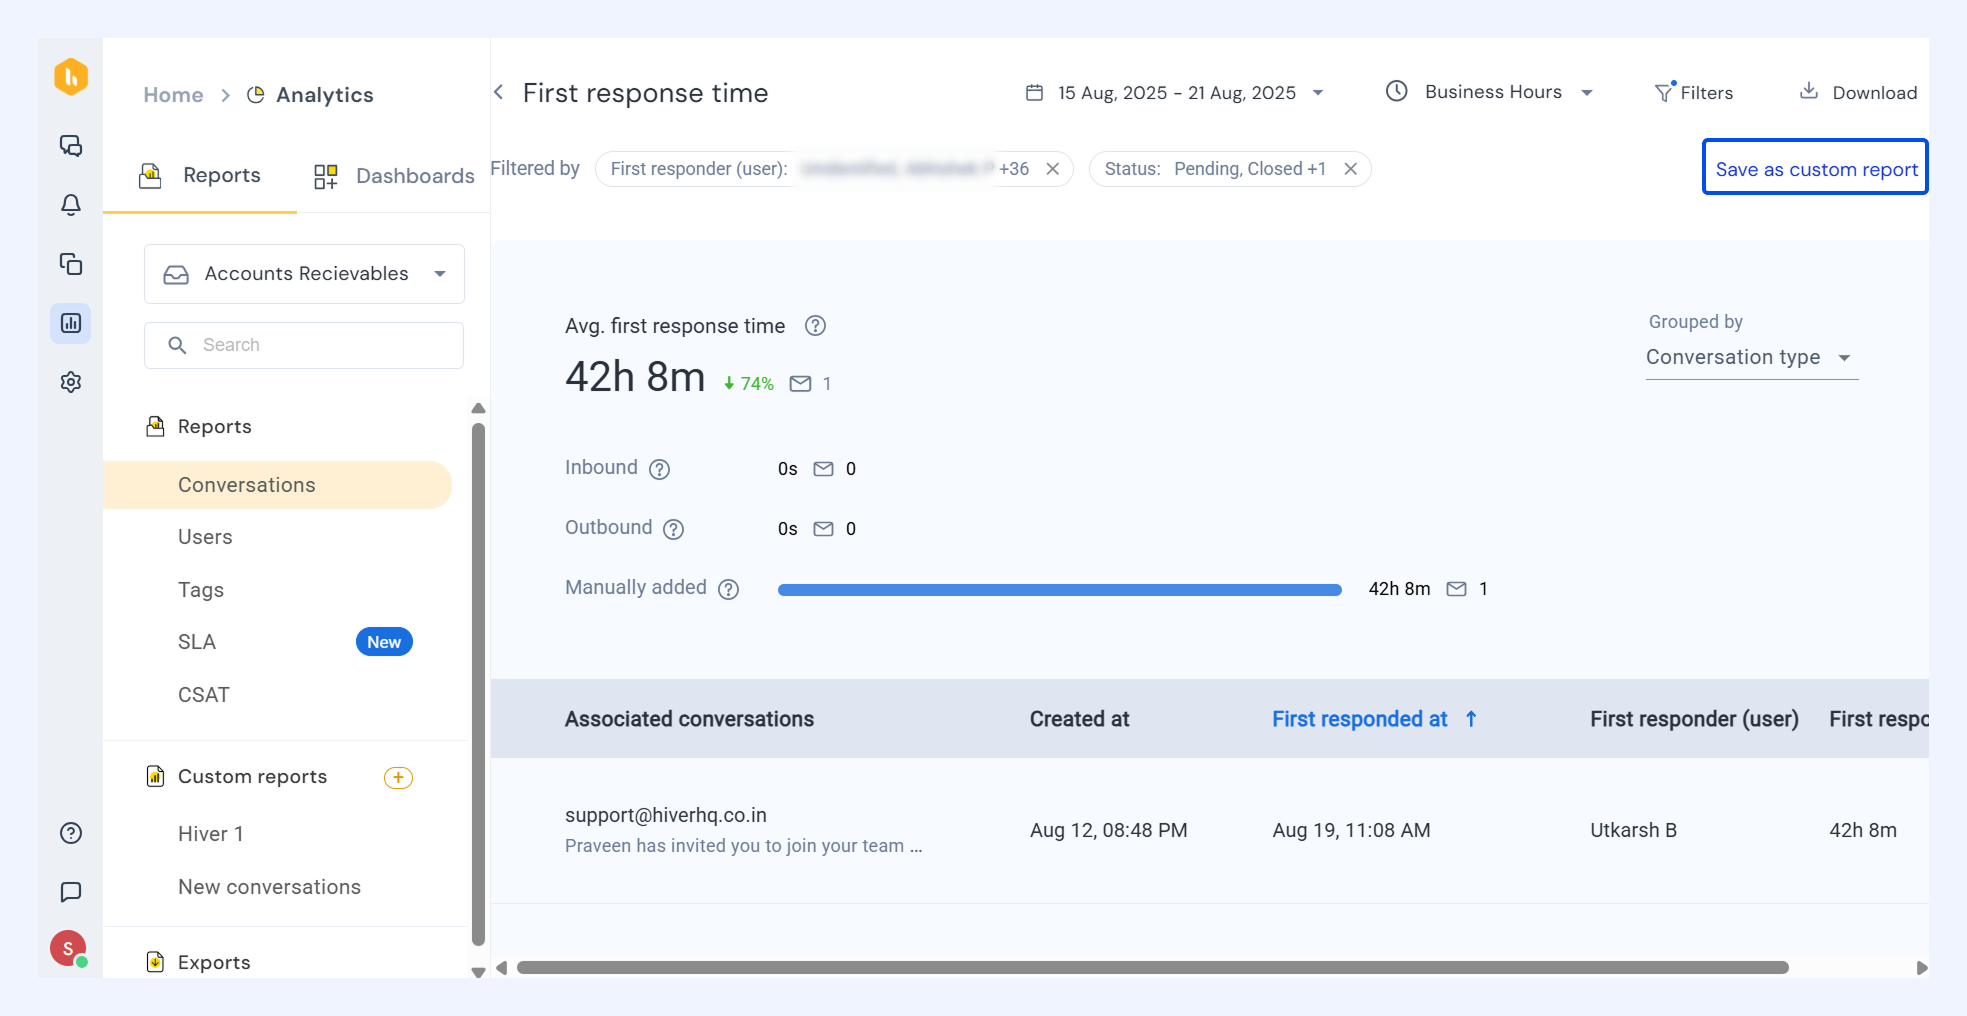
3. Click Apply to generate the filtered report, then select Save as Custom Report, enter a name, and click Save.
Managing a custom report
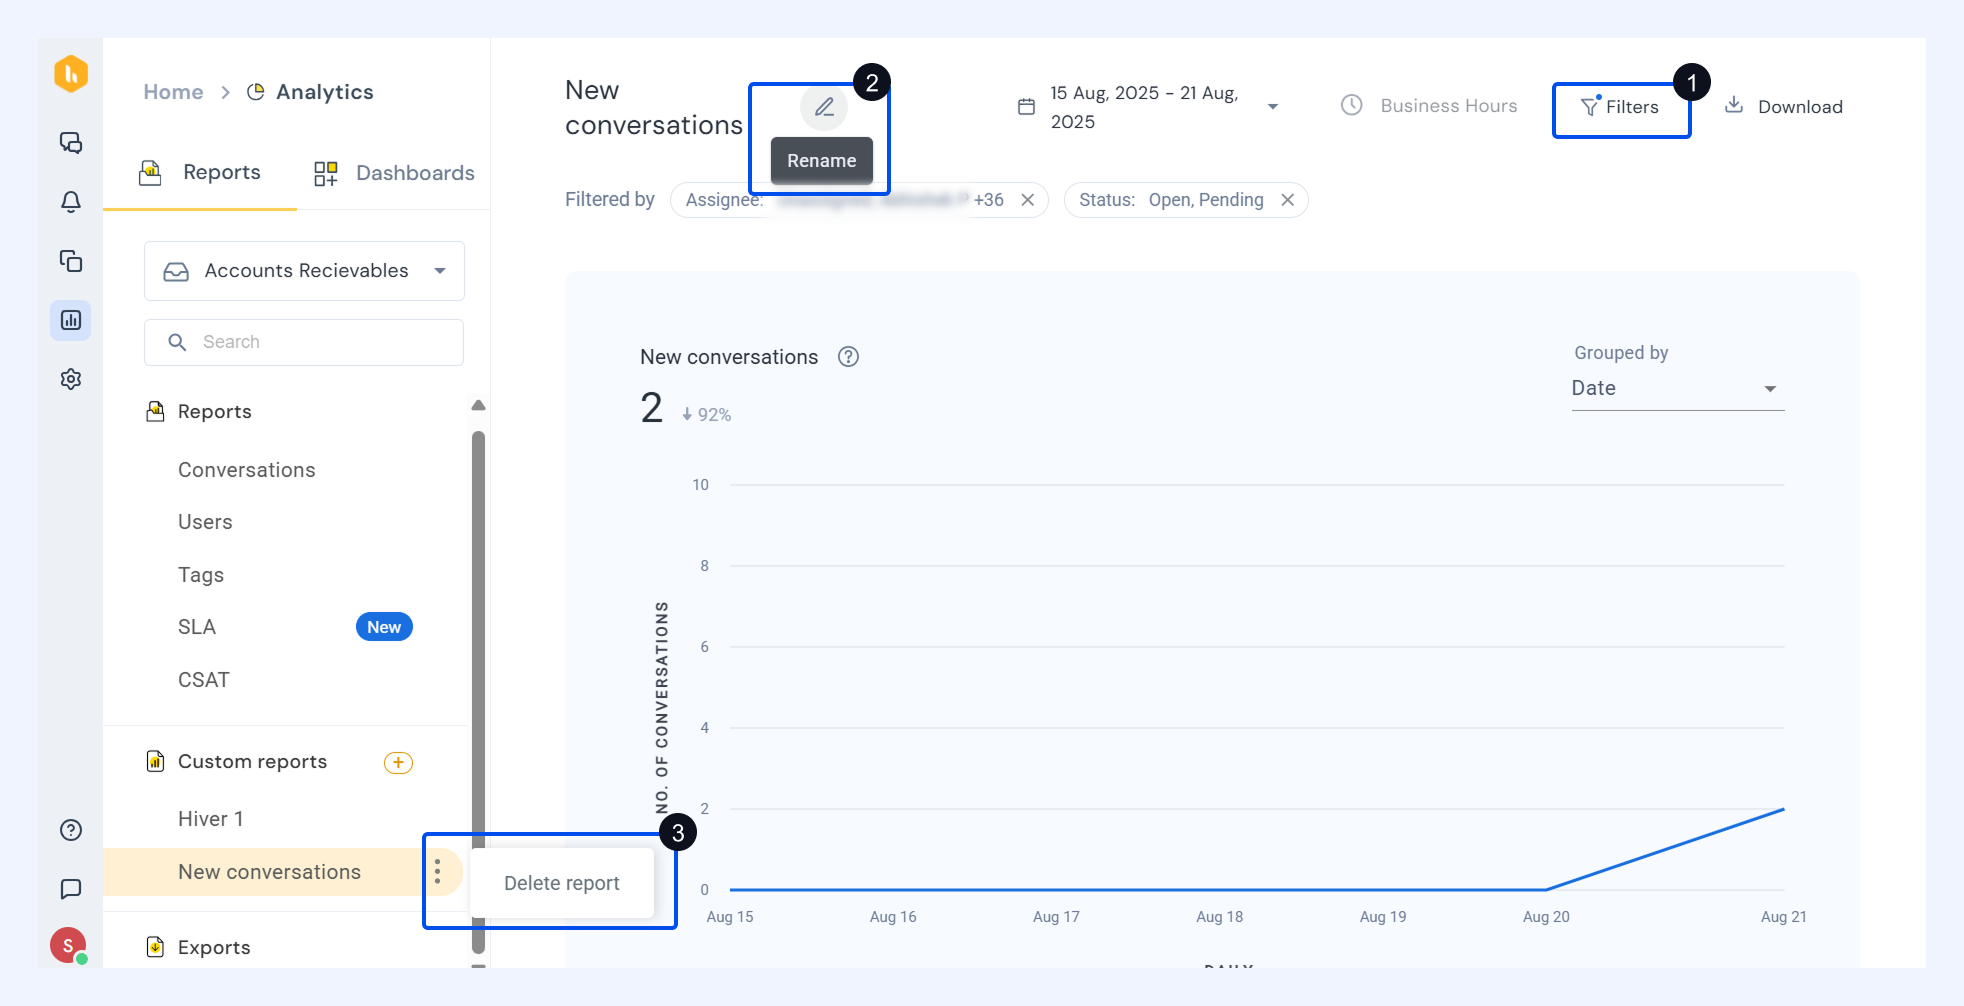
1. Editing a custom report:
- Open the report and click Filters → adjust filter conditions → Apply.
- Save changes to the existing report, or save as a new report.
2. Renaming a custom report:
- Open the report, click the Edit icon next to the report name, then enter a new name and click the ✔️ icon.
3. Deleting a custom report:
- In the left panel, click the three dots next to the report name.
- Select Delete Report and confirm by clicking Delete.
Exports
The Exports feature lets you download reports from Hiver as a CSV file. This is useful for sharing insights, performing offline analysis, or integrating data with other tools.
Find Exports in the bottom-most section of Reports in Hiver Analytics.
Create an Export
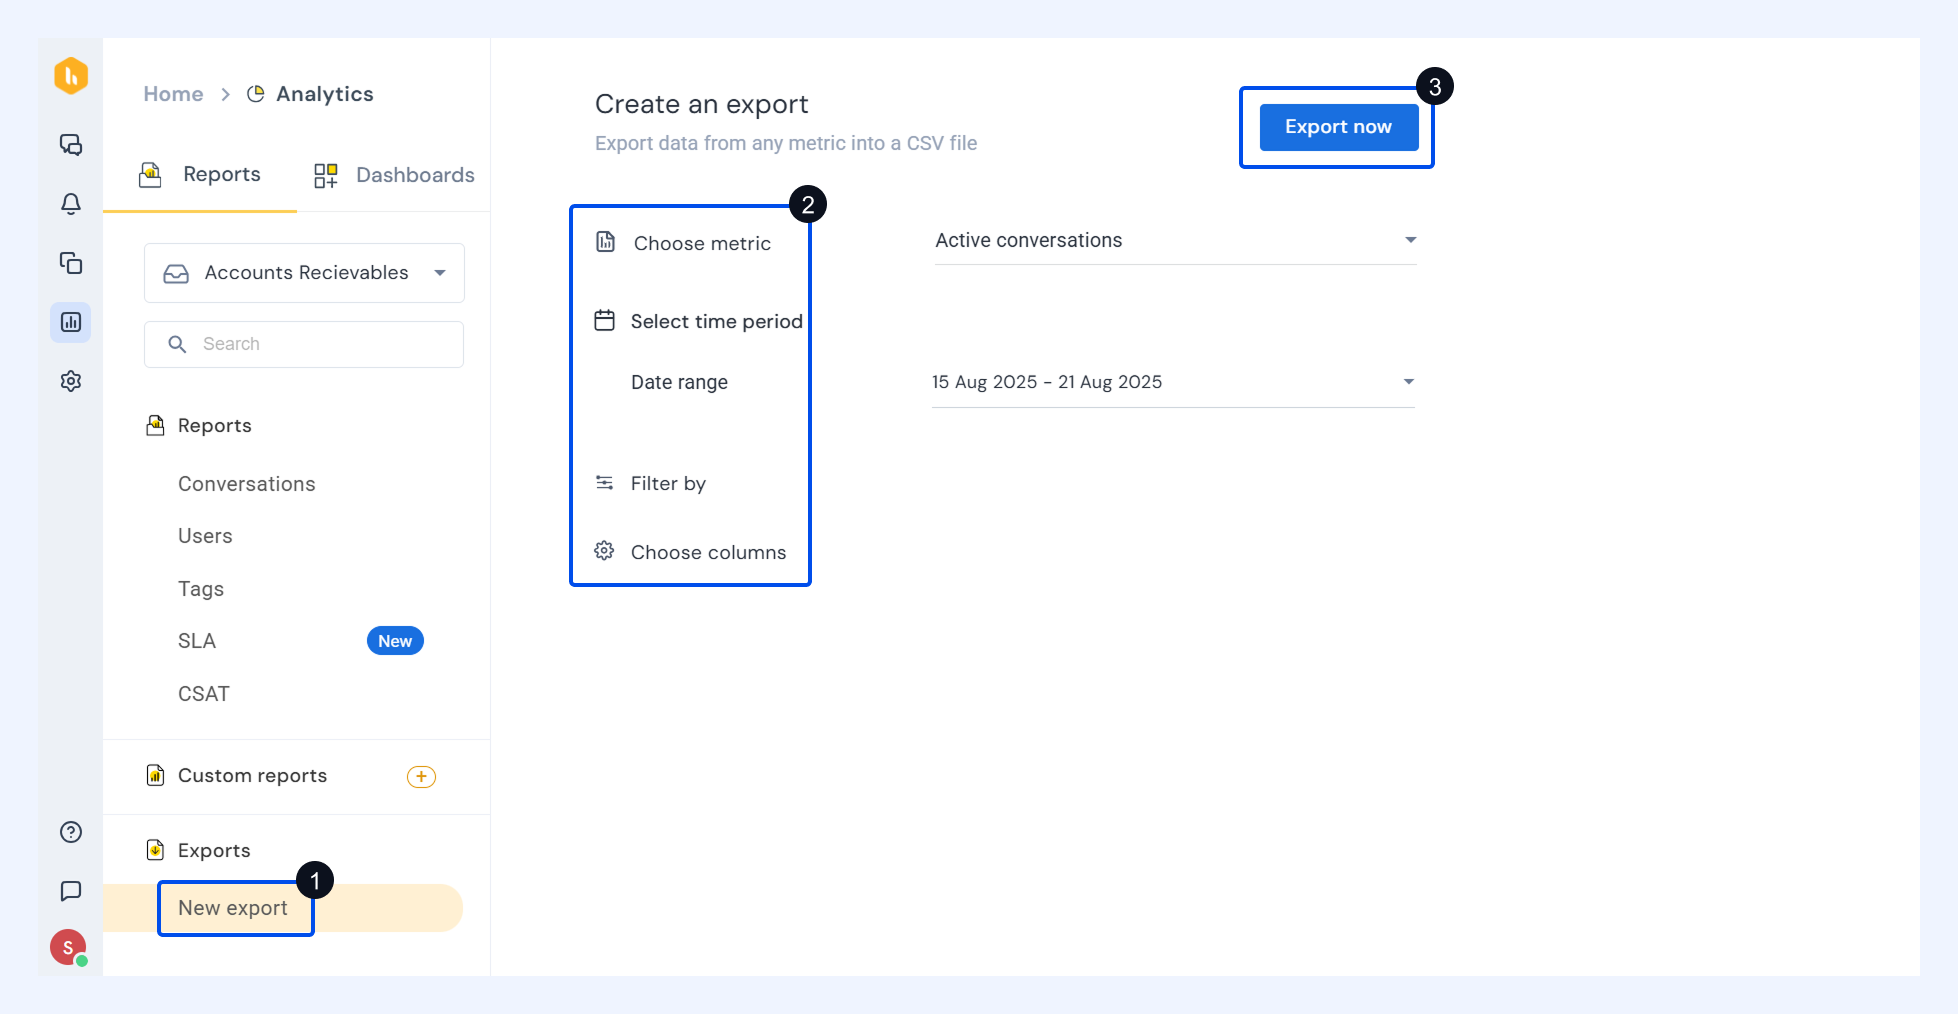
1. Go to Exports and click New Export.
2. Choose a metric: Select the report you want to export.
3. Choose a reporting period: Define the date range for your export.
4. Apply filters: Narrow results to the data you care about. (Filters vary depending on the metric you select.)
5. Select fields: Pick the specific fields you want included in the CSV file in Choose columns.
6. Export: Select Export now.
The data will begin downloading automatically in your browser.