Users report
The user report in gives you a clear view of how your team manages conversations using Hiver in Gmail.
It helps you track who’s handling the most workload, how quickly they respond, and how customers rate their interactions. Use it to identify top performers, spot bottlenecks, and balance workloads effectively.
Get started with the user report
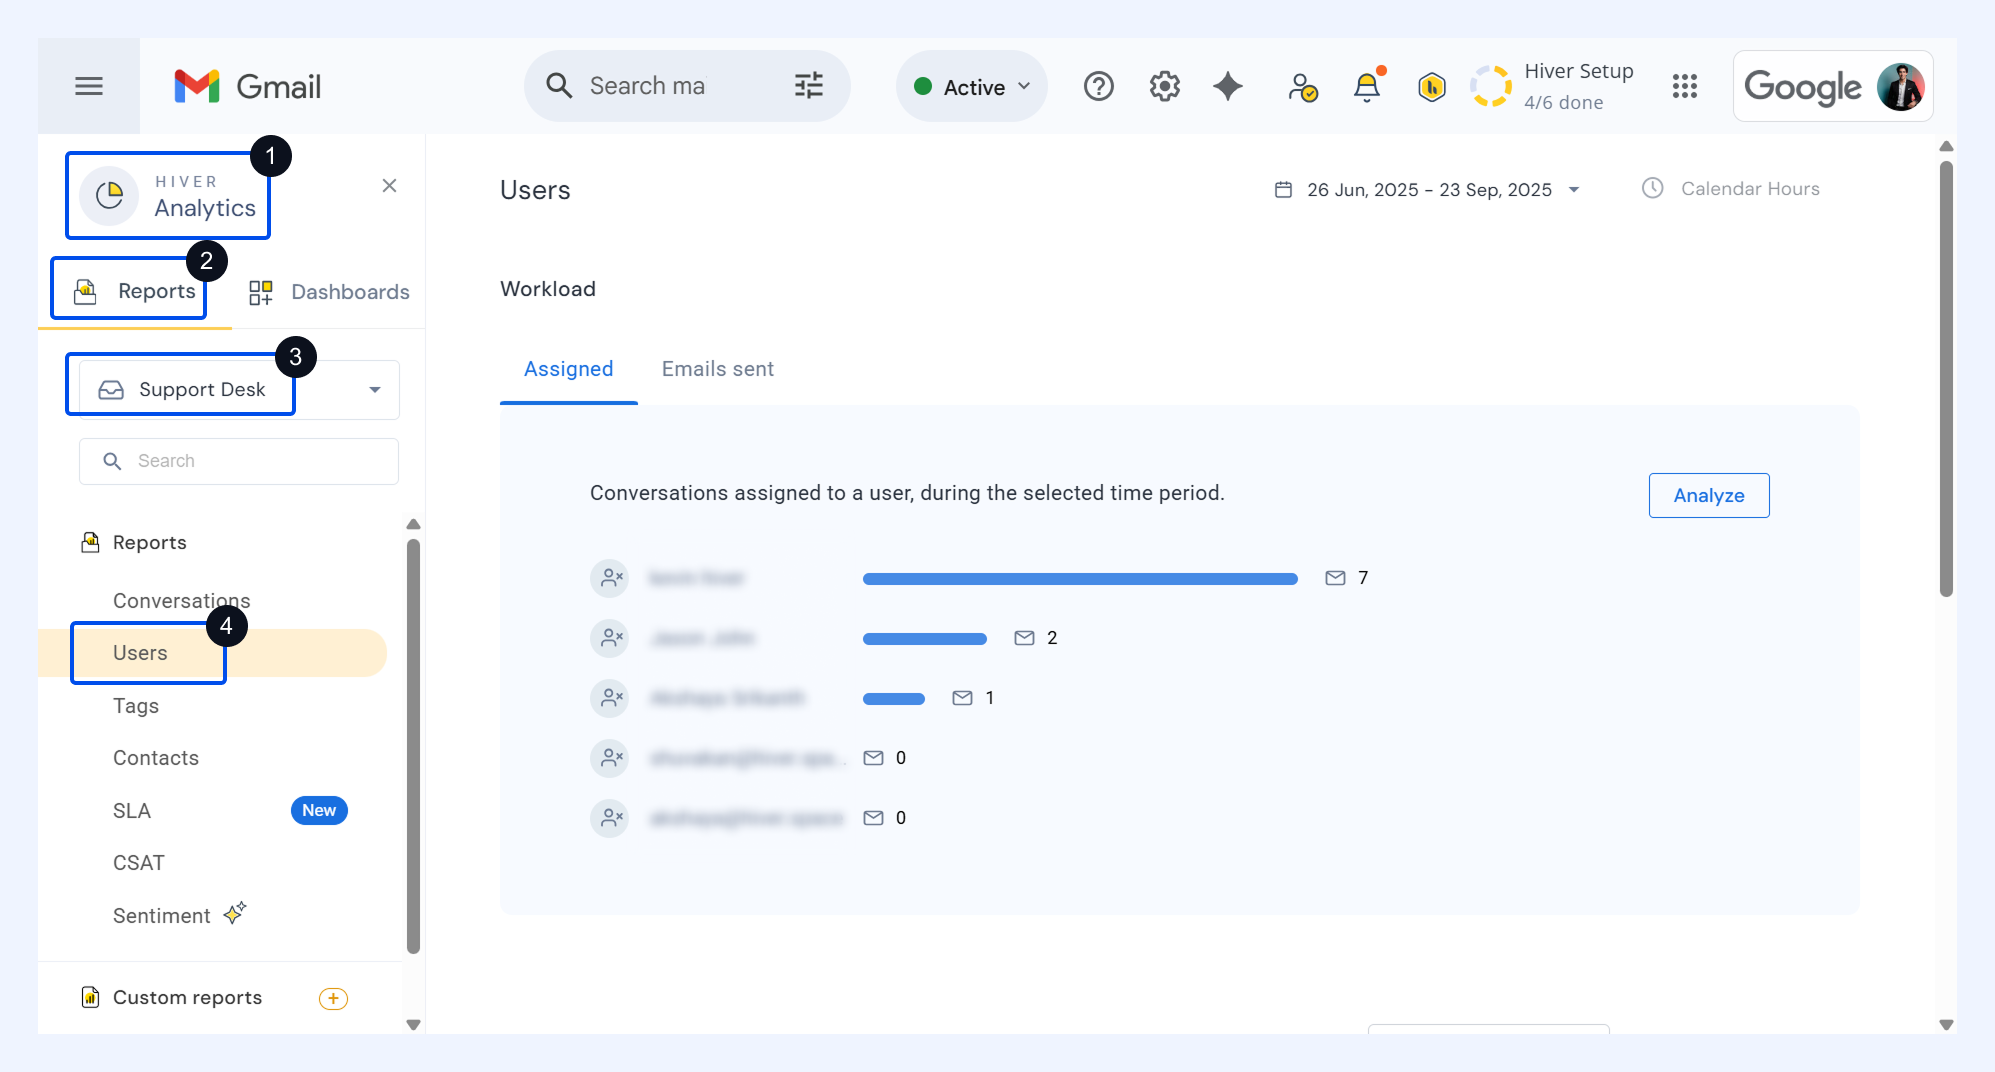
To access the Users report, go to Analytics → Reports → select your Shared Inboxes → Users.
All metrics are calculated based on the selected date range. You can also switch between business hours and calendar hours as needed.
Workload metrics
The Workload section shows how conversations are distributed among team members, helping you track assignments and email volume. Use it to understand how work is shared and identify potential imbalances.
Assigned conversations
Shows the number of unique Gmail conversations assigned to each user during the reporting period.
Explore the report
The report’s overview includes:
i) The total number of Assigned conversations.
ii) A breakdown by user to show how the workload was distributed.
Drill down
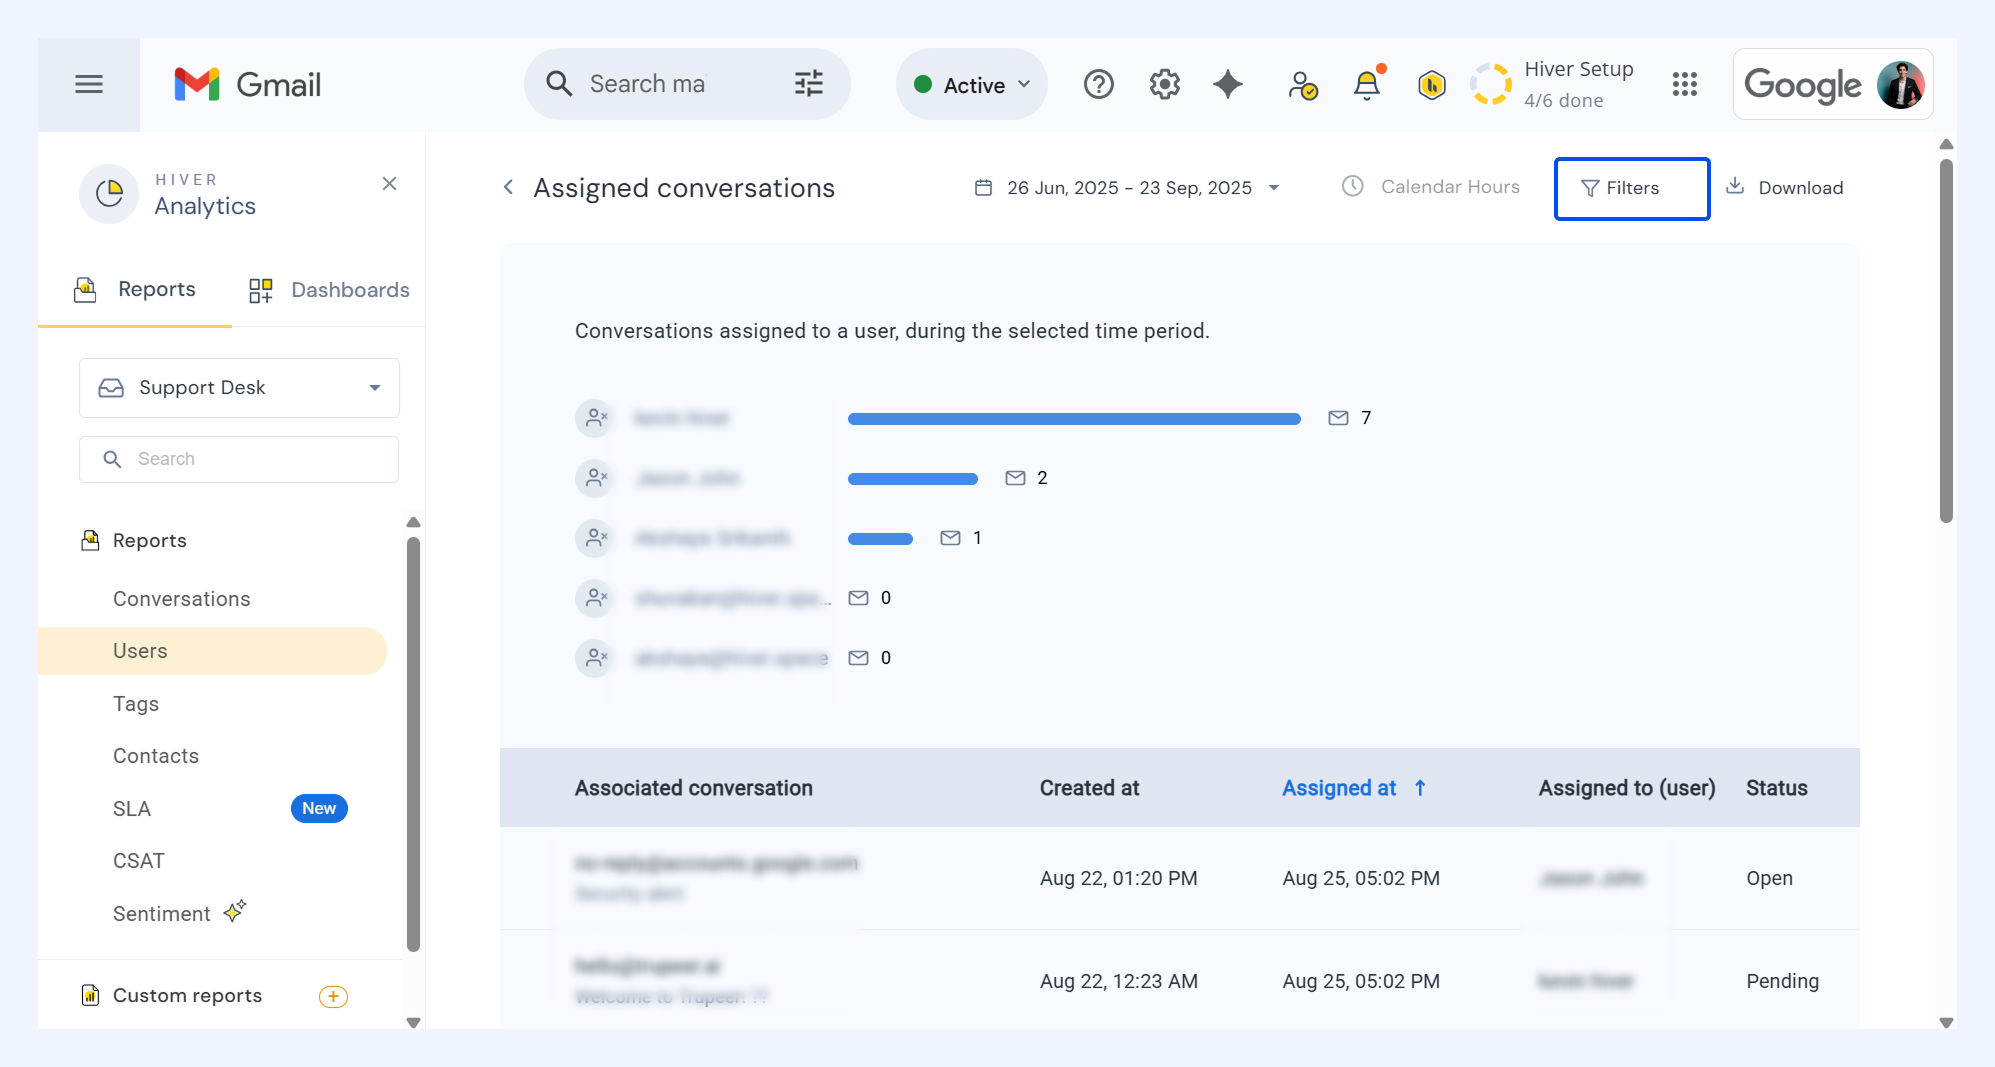
Click Analyze to dive deeper. You can:
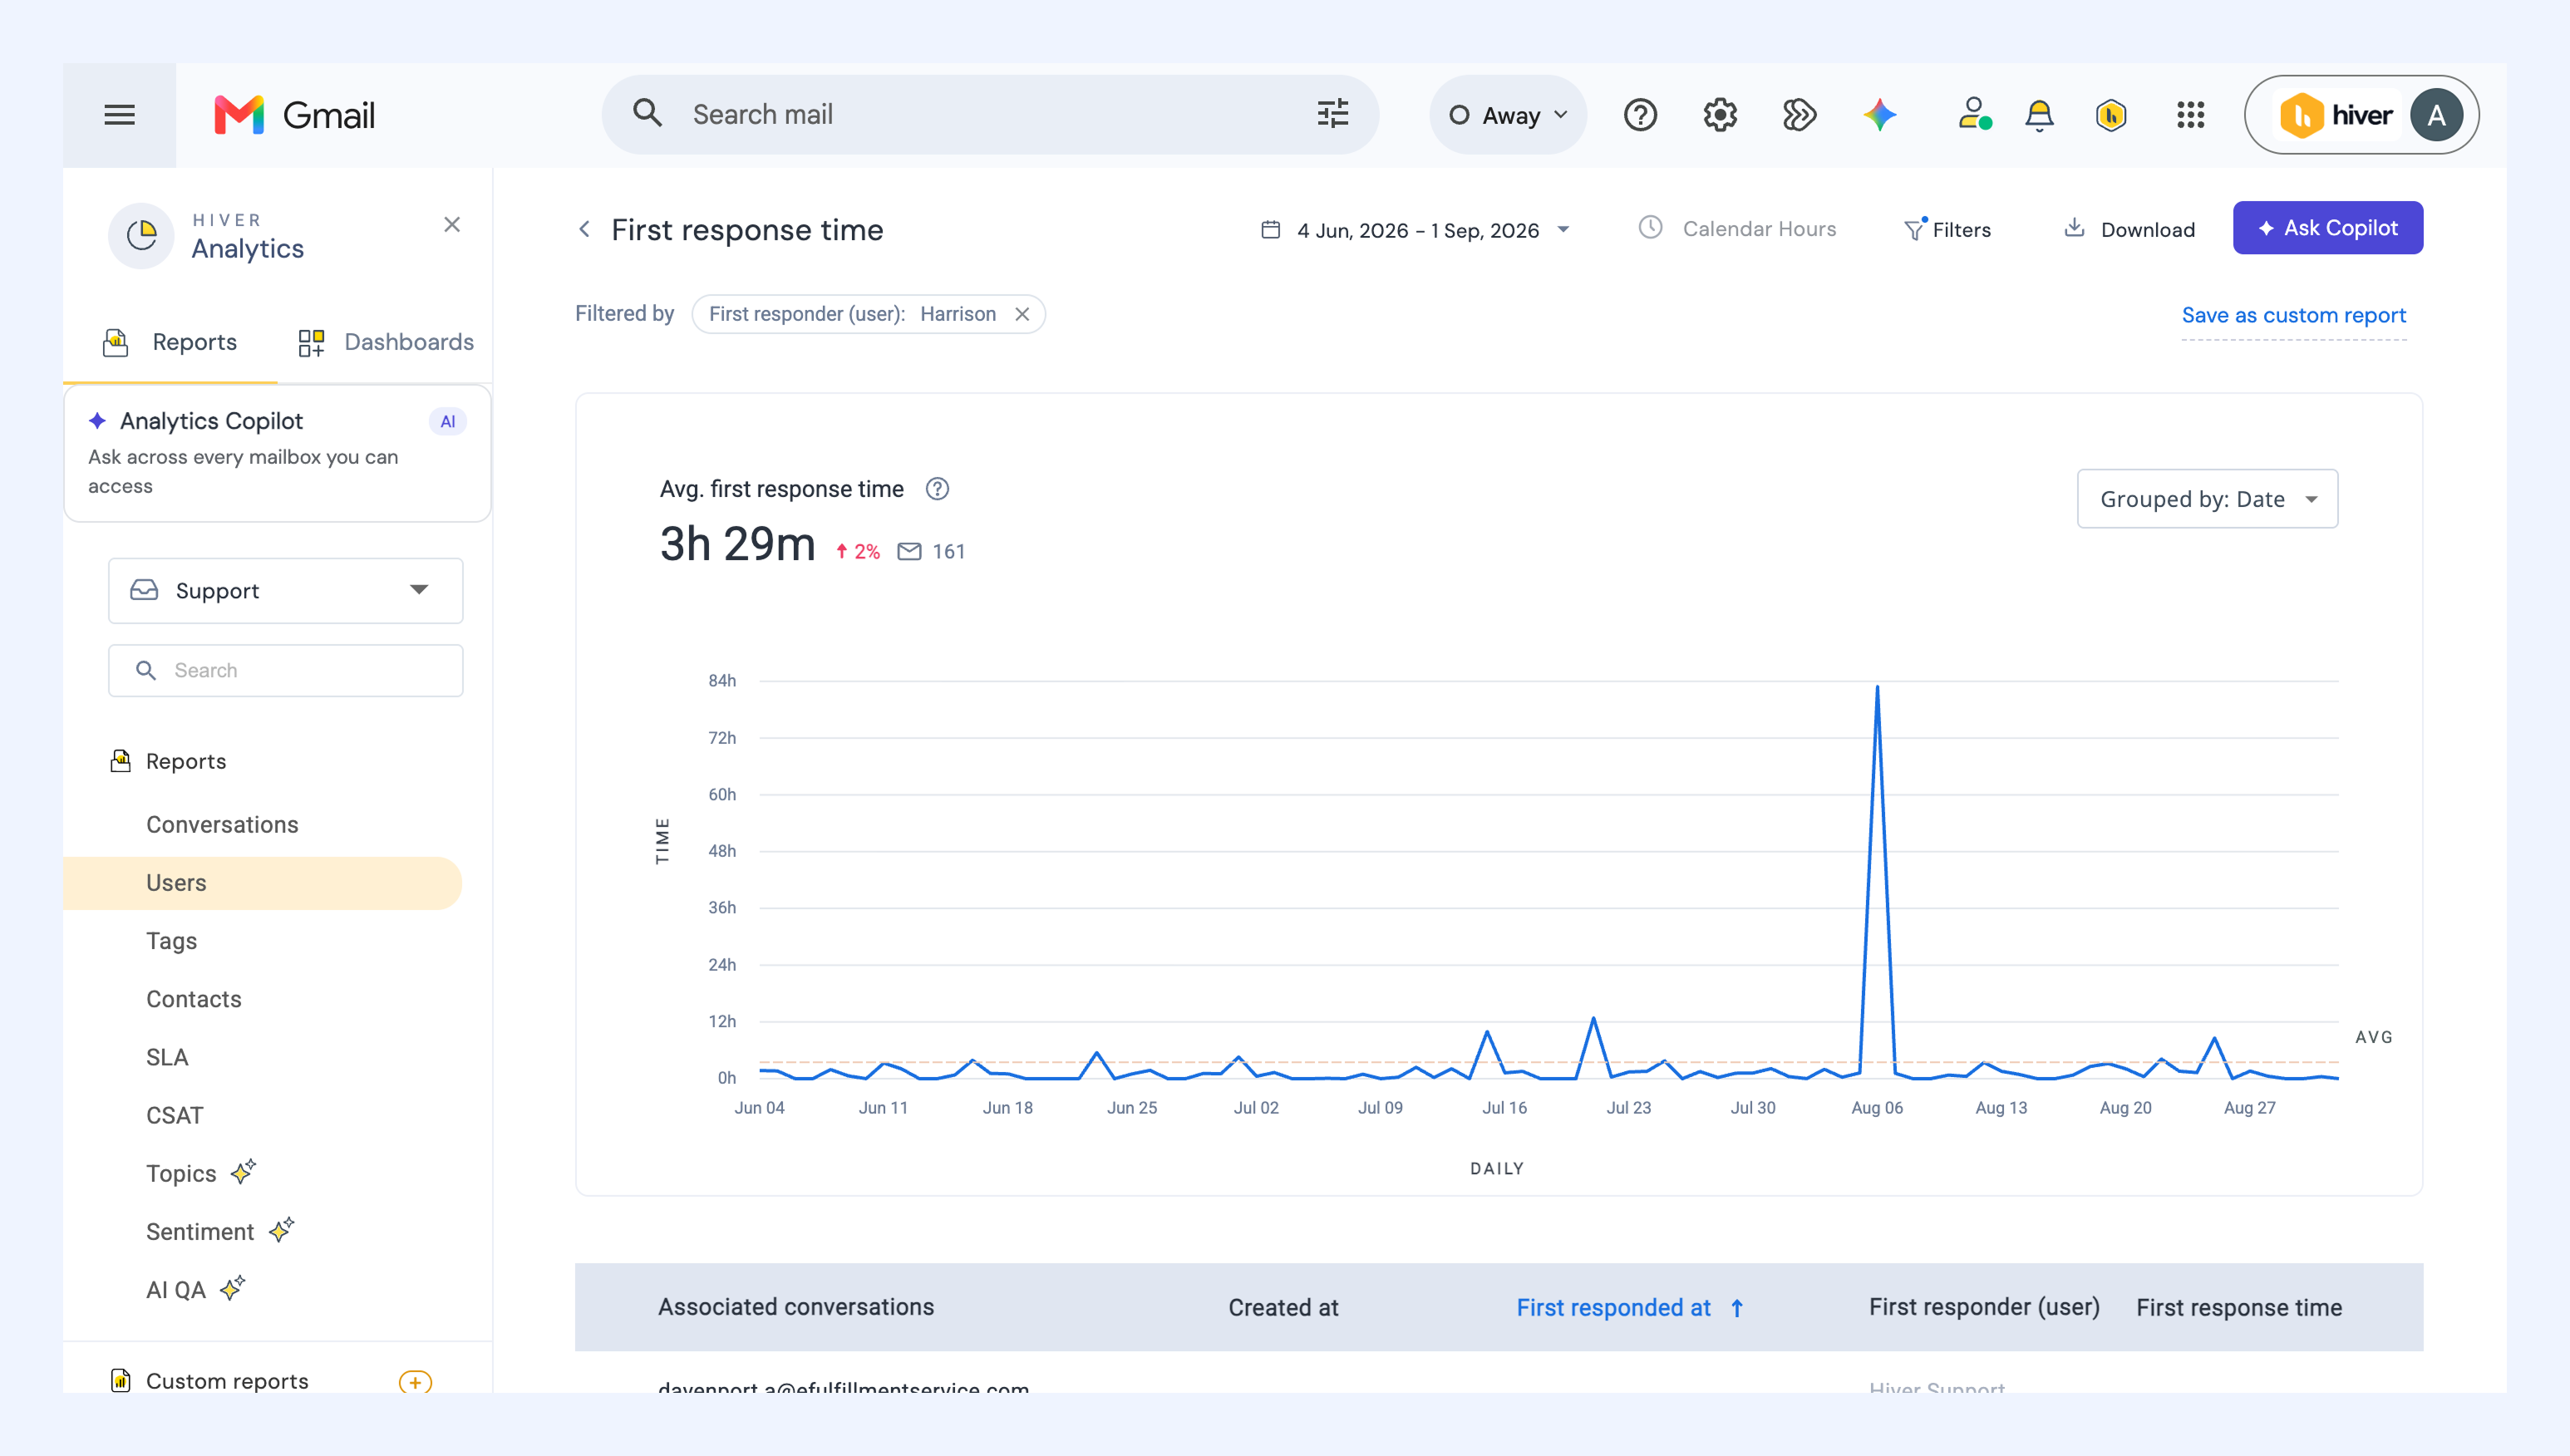
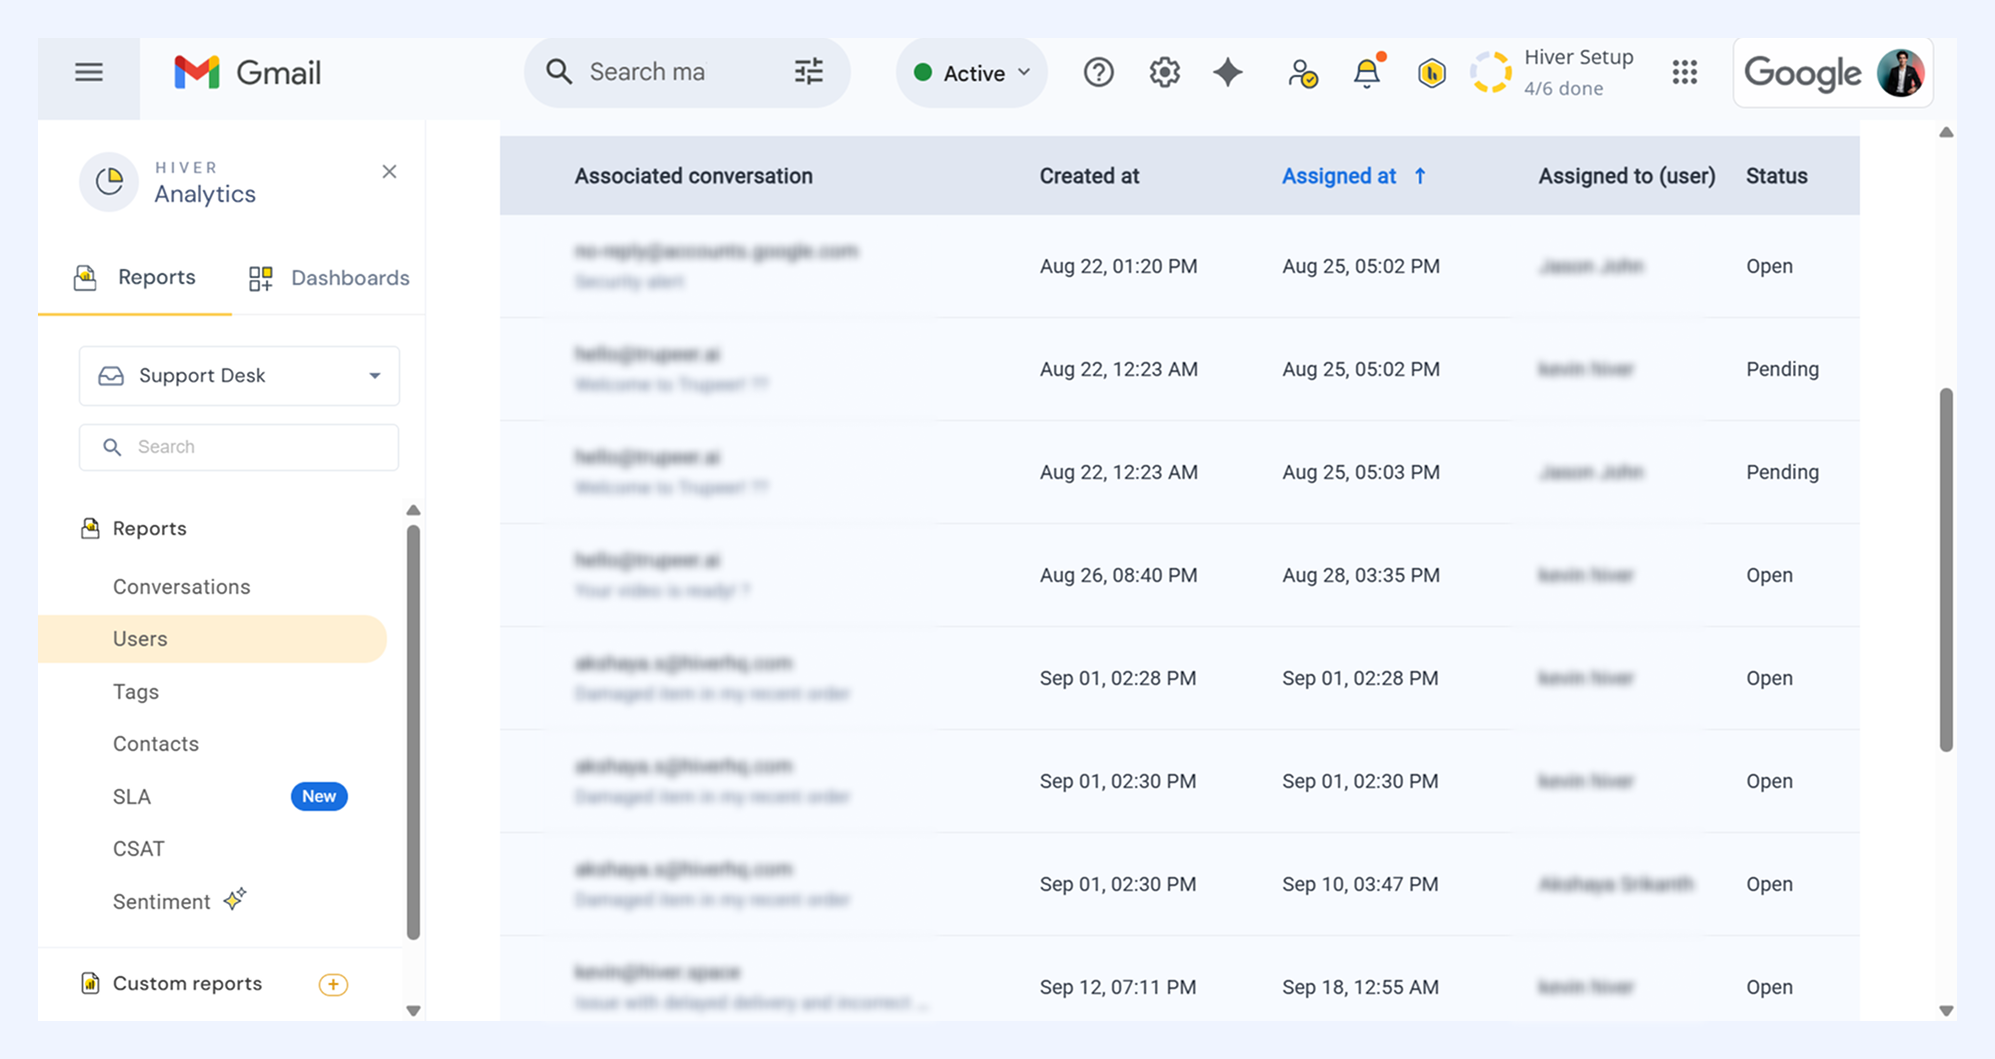
- See related conversations including the details like created and assigned at timestamps, assigned to, and status.
Note: If a conversation was assigned to more than one user, each assignment appears as a separate row.
- Apply filters to narrow results by assigned to, tags, conversation type, due date, and priority.
Emails sent
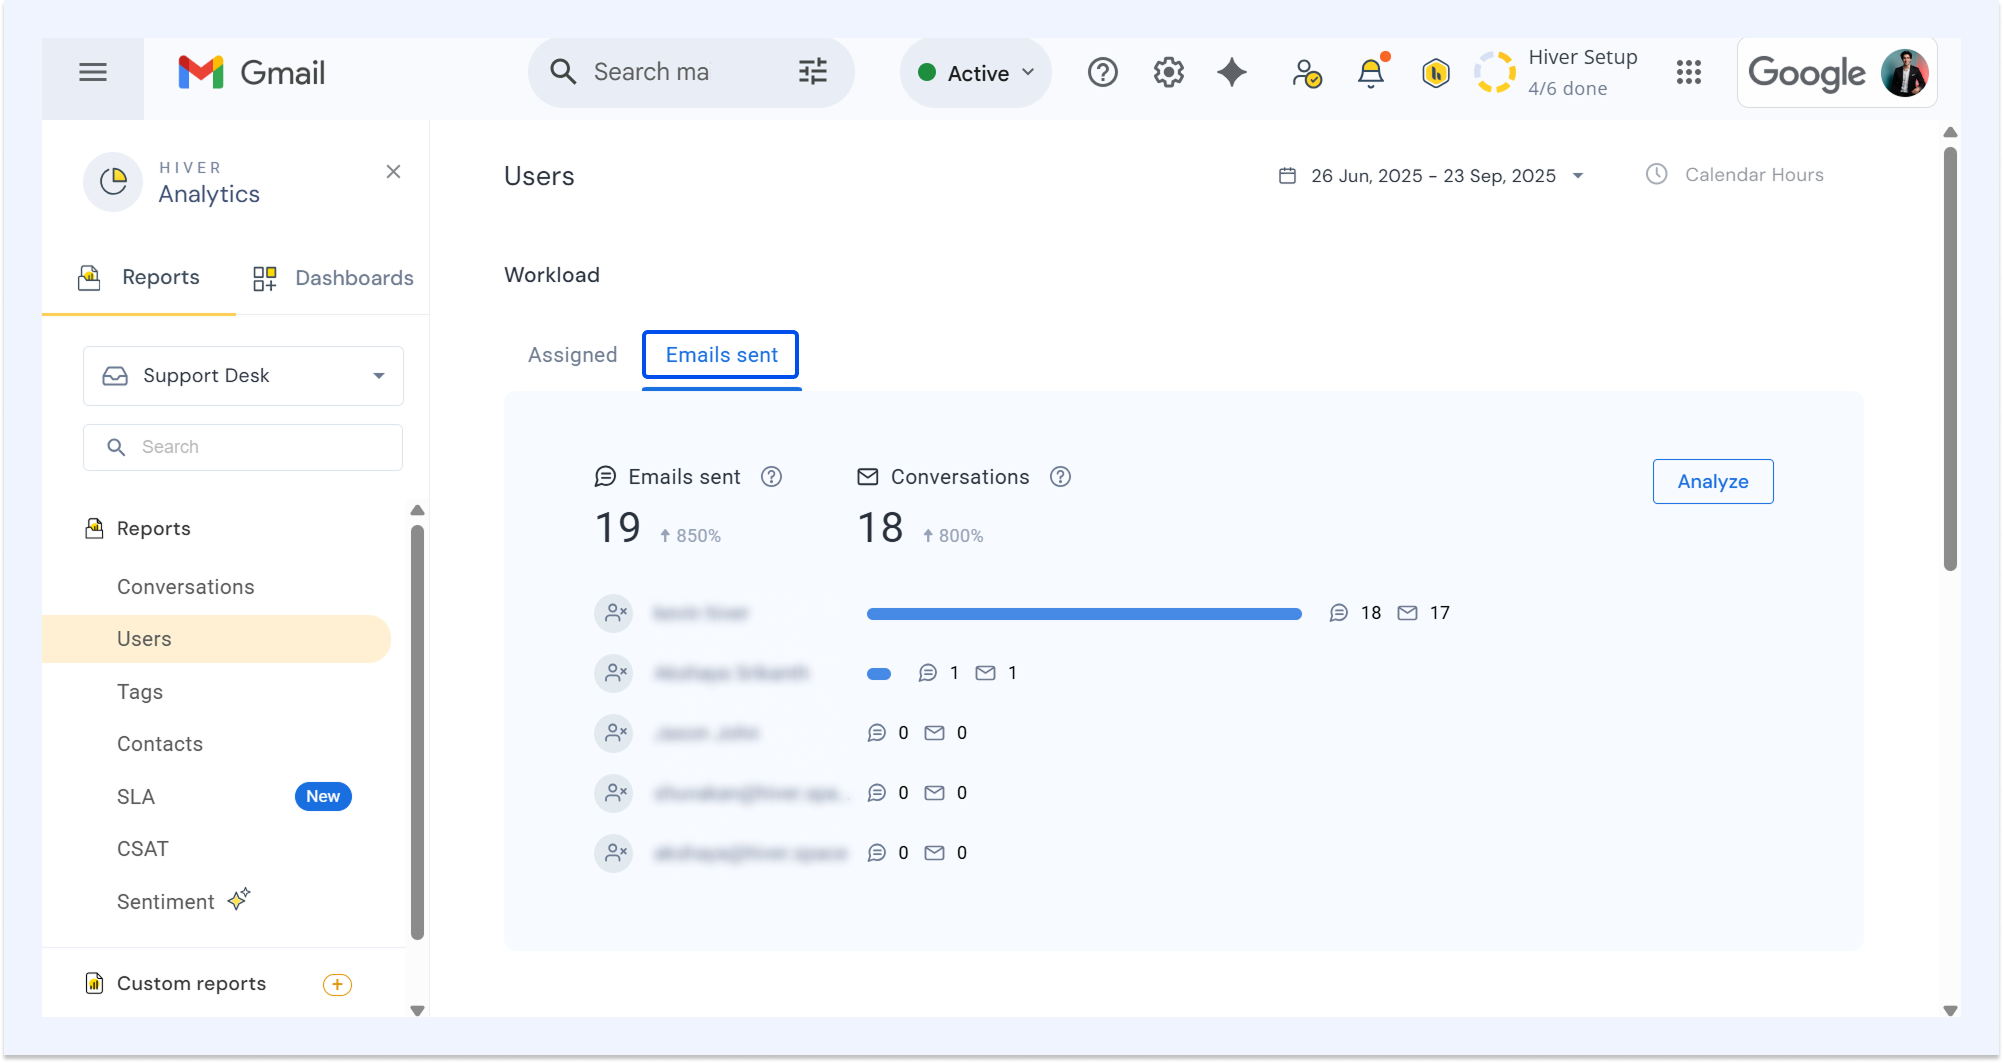
Shows the total number of emails a user sent from the Shared Inbox during the reporting period.
Explore the report
The report’s overview includes:
i) The total count of sent emails
ii) The number of conversations with at least one sent email
iii) The percentage change in sent emails compared to the previous reporting period
Drill down
Click Analyze to dive deeper. You can:
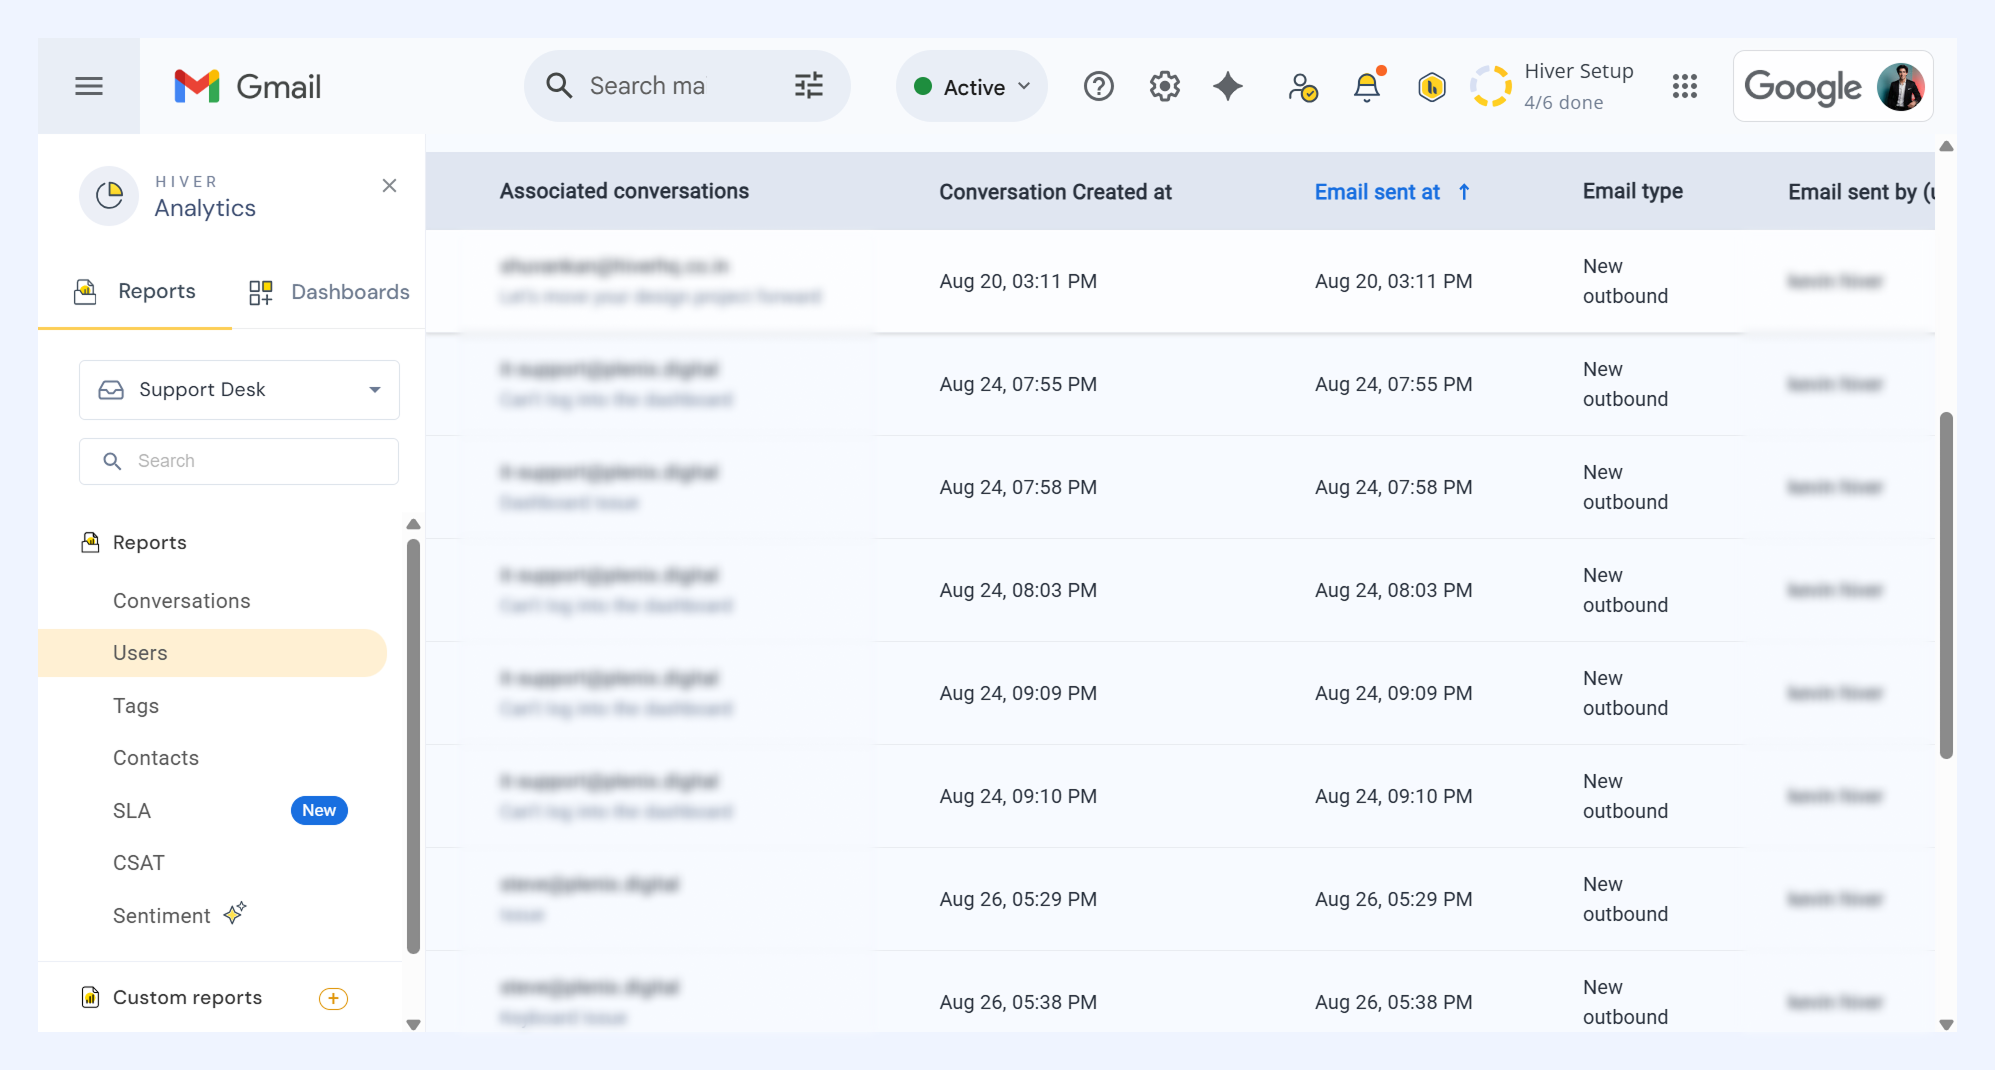
- Conversations with details like conversation ID, created at, email sent at, email type, sent by (user), and response time.
Note: Email types include:
1. New outbound: First email of the conversation, sent from the Shared Inbox.
2. First response: First reply to the initial incoming email.
3. Next response: Reply to an email in an ongoing conversation.
4. Periodic response: A follow-up email sent from the Shared Inbox.
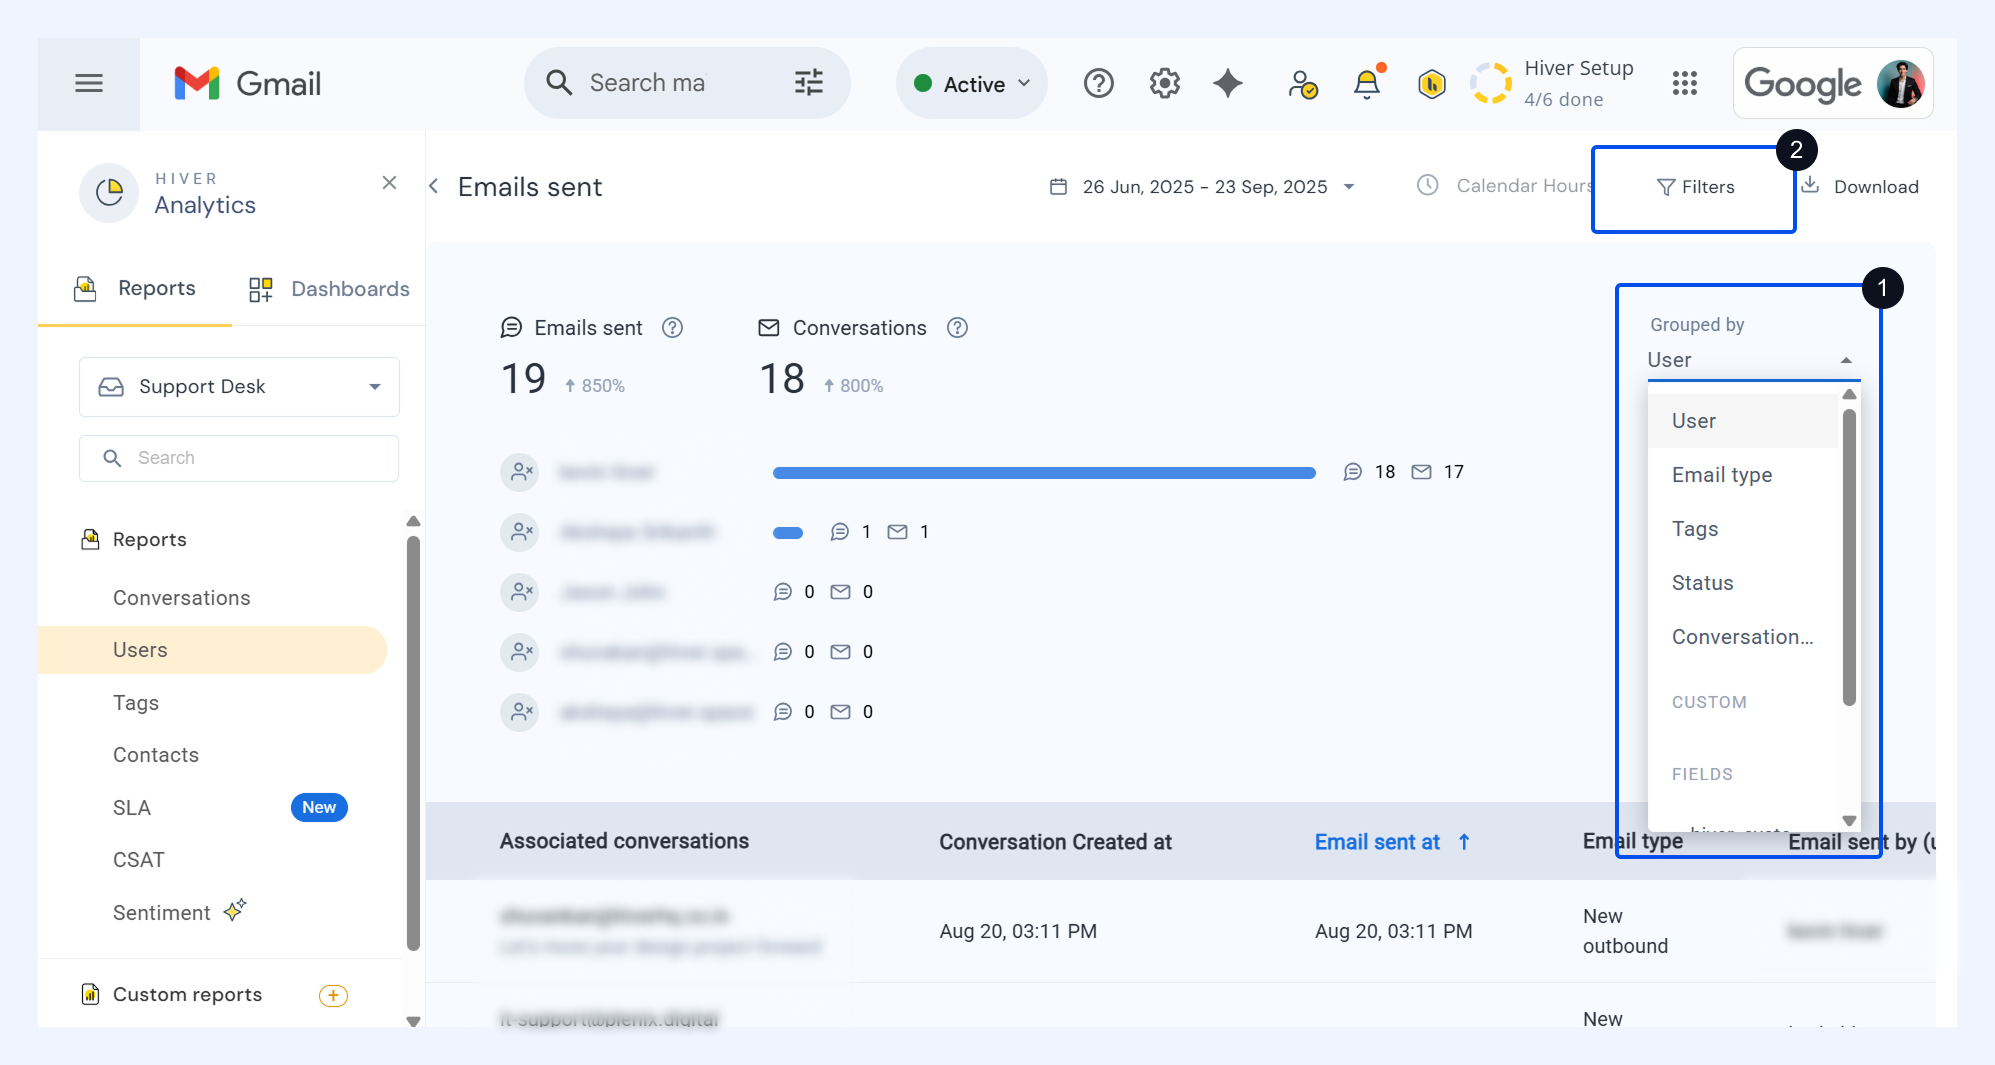
- Group data by user, email type, tags, status, conversation type, or custom fields.
- Filter results by user, status, email type, due date, or priority.
Performance metrics
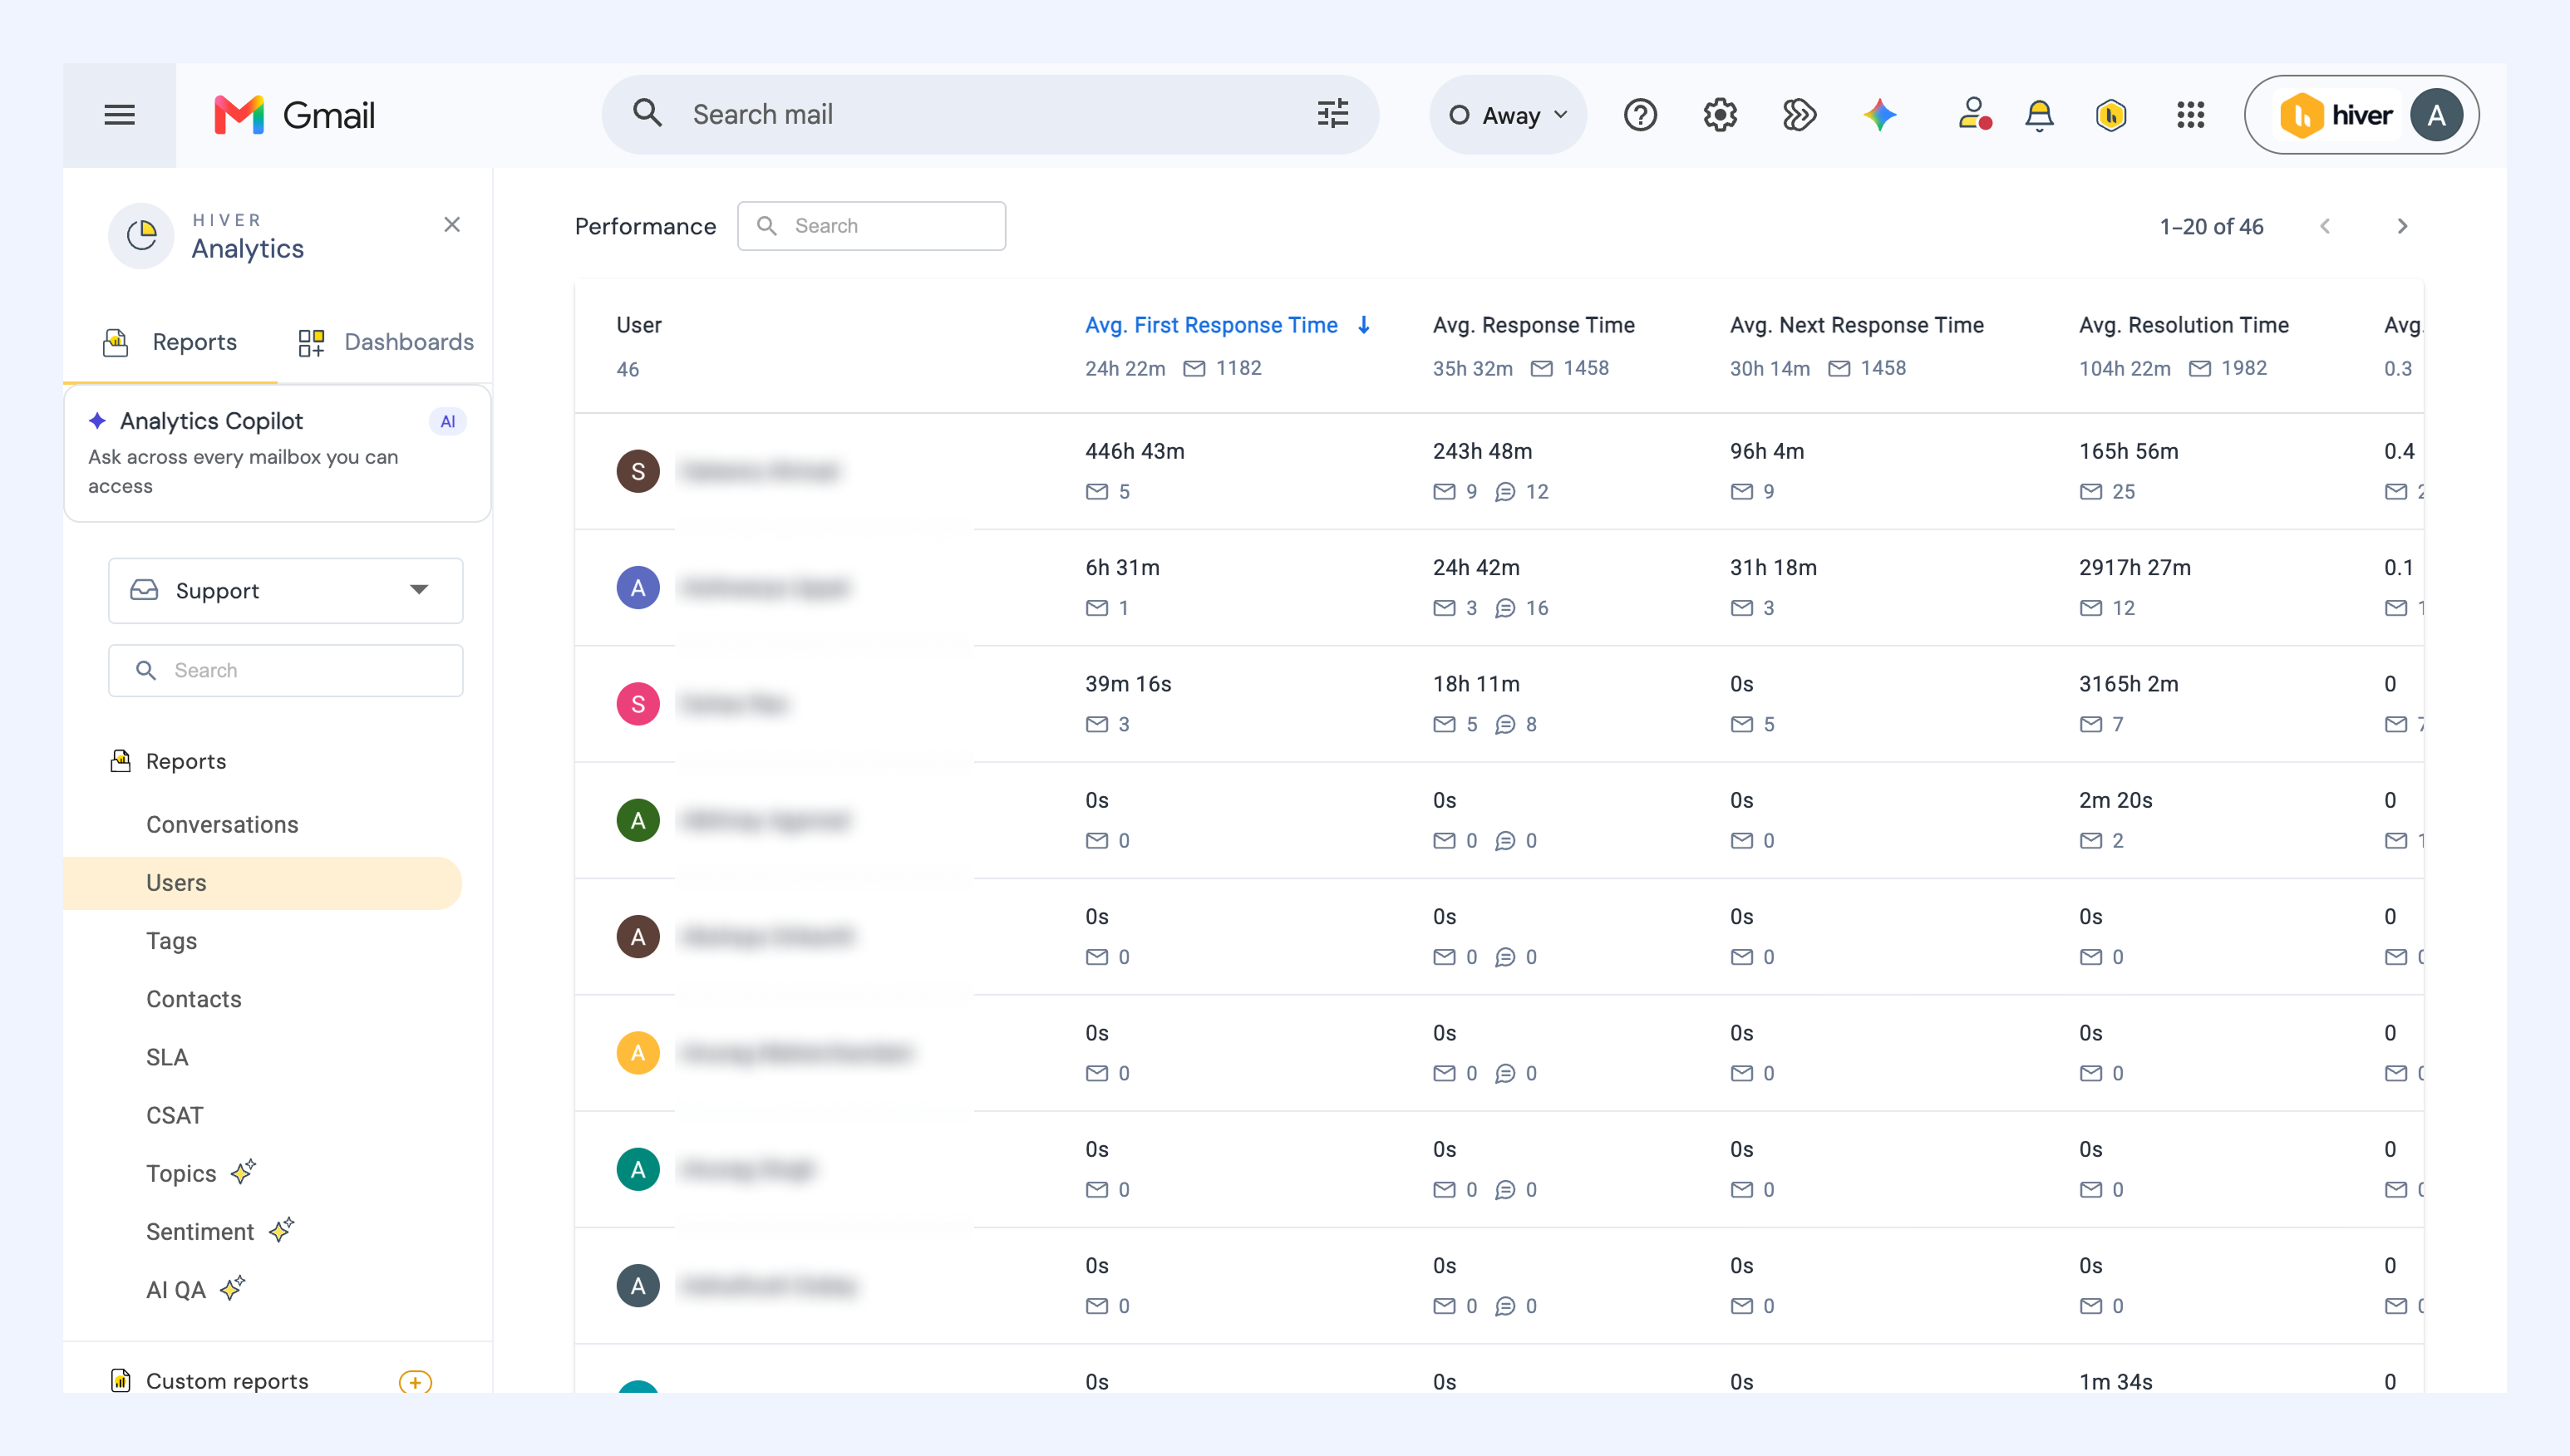
The Performance section shows performance metrics for each team member in a Shared Inbox. Use it to evaluate responsiveness and customer experience quality.
Explore the report
The report’s overview includes:
- Average first response time: The time it takes a user to send their first reply in a conversation.
- Average response time: The average time a user takes to reply across a conversation.
- Average next response time: The average time a user takes to reply after the customer's first unanswered message.
- Average resolution time: The time it takes a user to fully resolve conversations.
- Average replies to resolution: The average number of replies a user sends before resolving a conversation.
- First Contact Resolution: The share of a user's resolved conversations that were closed with a single reply.
- CSAT: The percentage of customer satisfaction ratings for conversations handled by the user.
Drill down
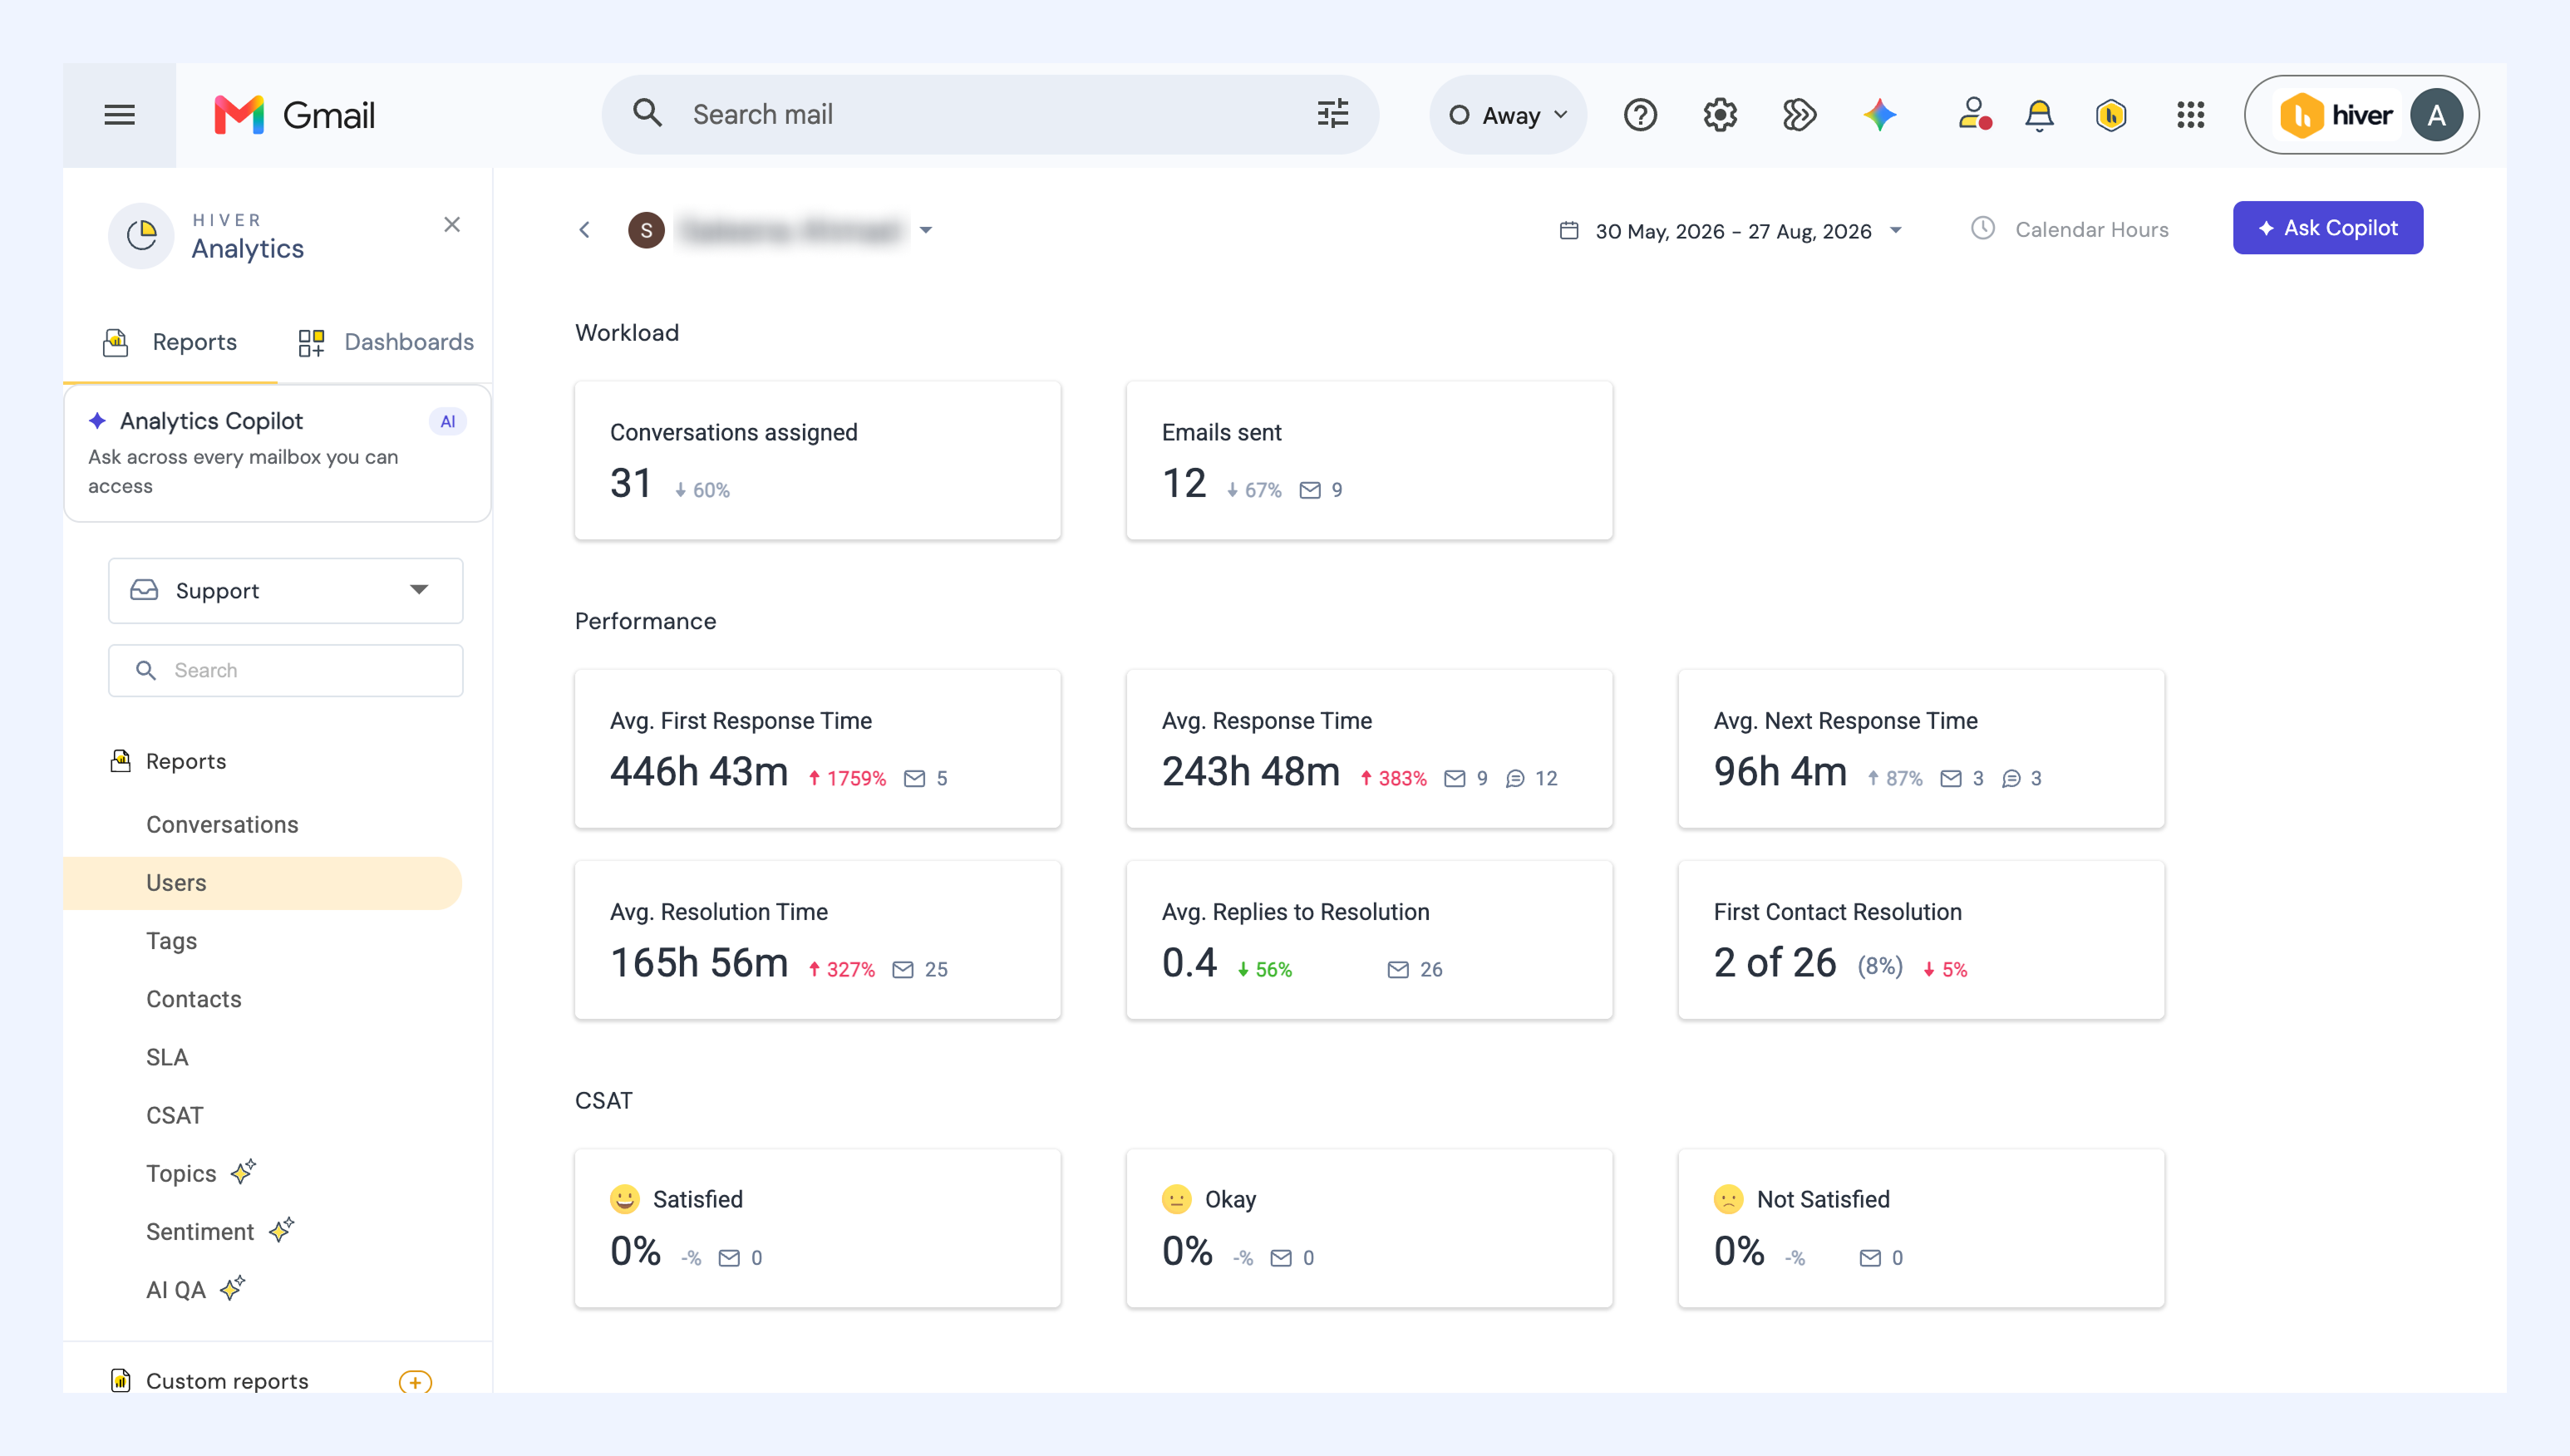
Click a user’s name in the Performance table to open a detailed view. You’ll see a summary of key metrics across three sections:
- Workload: Shows the number of conversations assigned and emails sent.
- Performance: Displays the average first response time, average response time, average next response time, average resolution time, average replies to resolution, and first contact resolution.
- CSAT: Highlights the user’s customer satisfaction rating (in percentage).
Explore associated conversations
Click any metric value (for example, Average first response time or CSAT) to view the conversations that contributed to it. This helps you understand the context behind performance data and uncover specific patterns affecting response quality or speed.