Tags report
Tags report in Hiver Analytics gives you a clear picture of how conversations are distributed across categories in your Shared Inbox and how your team is performing within each category.
Use this report to:
- Identify which topics generate the most conversations.
- Track workload across areas like billing, product support, or feature requests.
- Measure performance through metrics such as response time, resolution time, and CSAT.
For example, if billing-related conversations are increasing while response times remain high, it may indicate a need for additional focus or resources. Conversely, consistently quick resolutions and strong CSAT in product support highlight areas where your team excels.
Get started with the Tags report
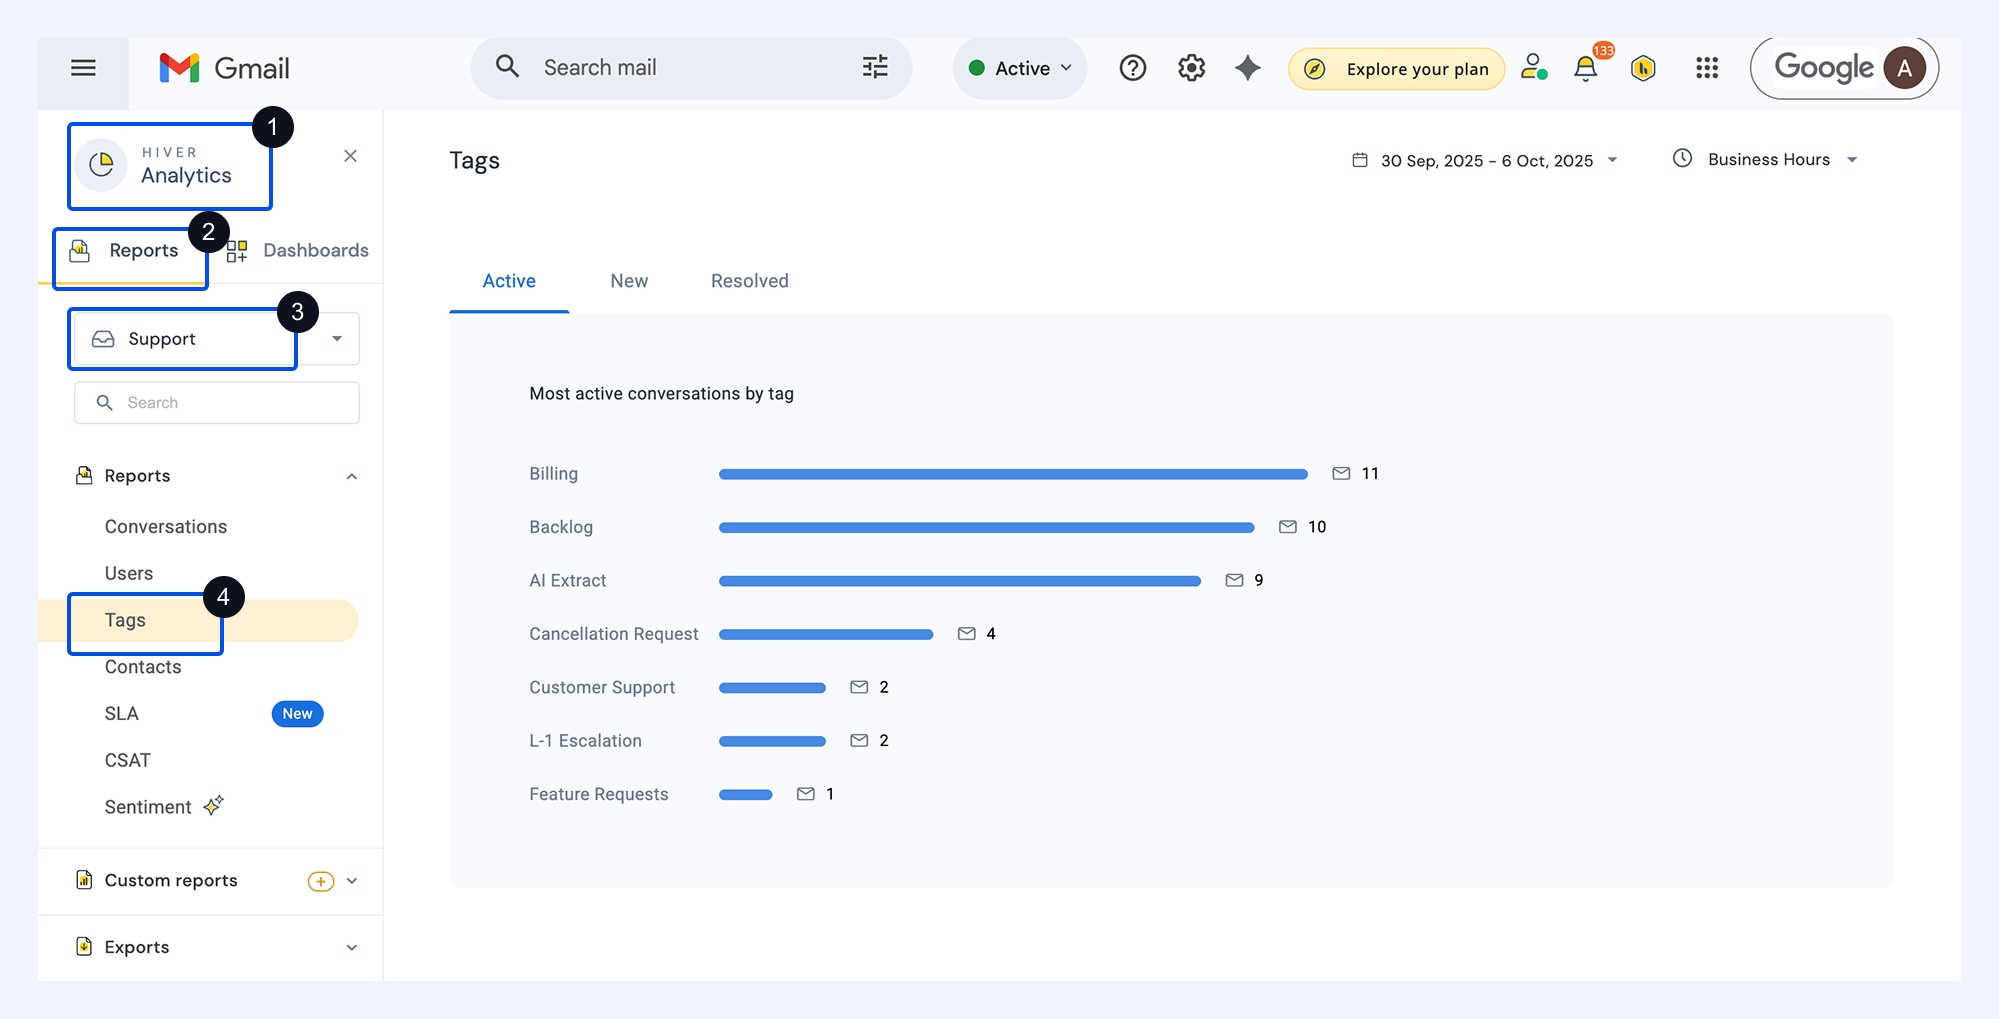
To access the Tags report, go to Analytics → Reports → select your Shared Inboxes → Tags.
All metrics are calculated based on the selected date range. You can adjust the date range or switch to Business Hours, if needed.
Views in Tags report
The overview displays your most frequently used tags, grouped into three key views:
View | What it shows |
Active Conversations | Conversations where at least one message was sent or received during the selected reporting period. |
New Conversations | Threads that were started or manually added to a Shared Inbox during the selected period. |
Resolved Conversations | Conversations that were closed within the period and not reopened afterward. |
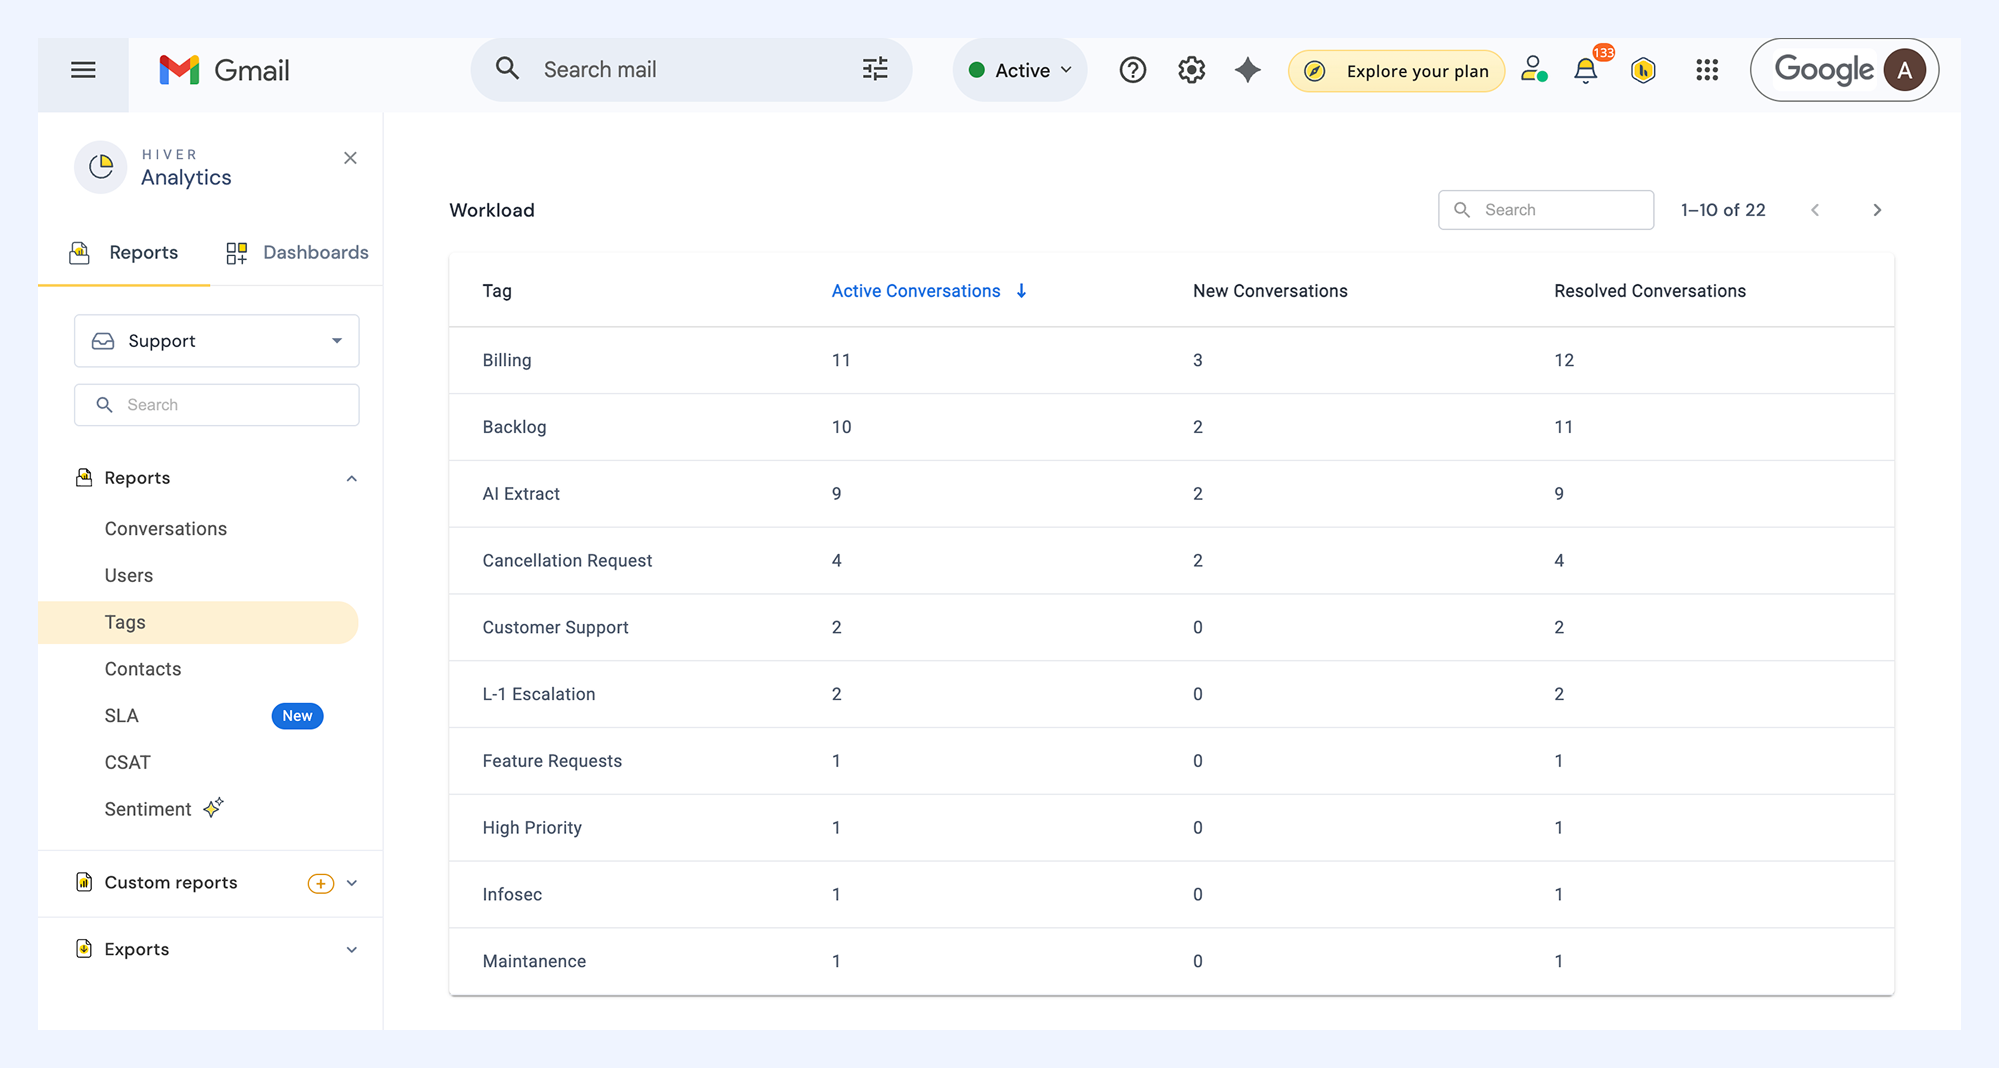
Workload metrics
This section shows the number of New, Active, and Resolved conversations associated with each tag. You can sort the table by conversation type to focus on the most relevant tags.
Performance metrics
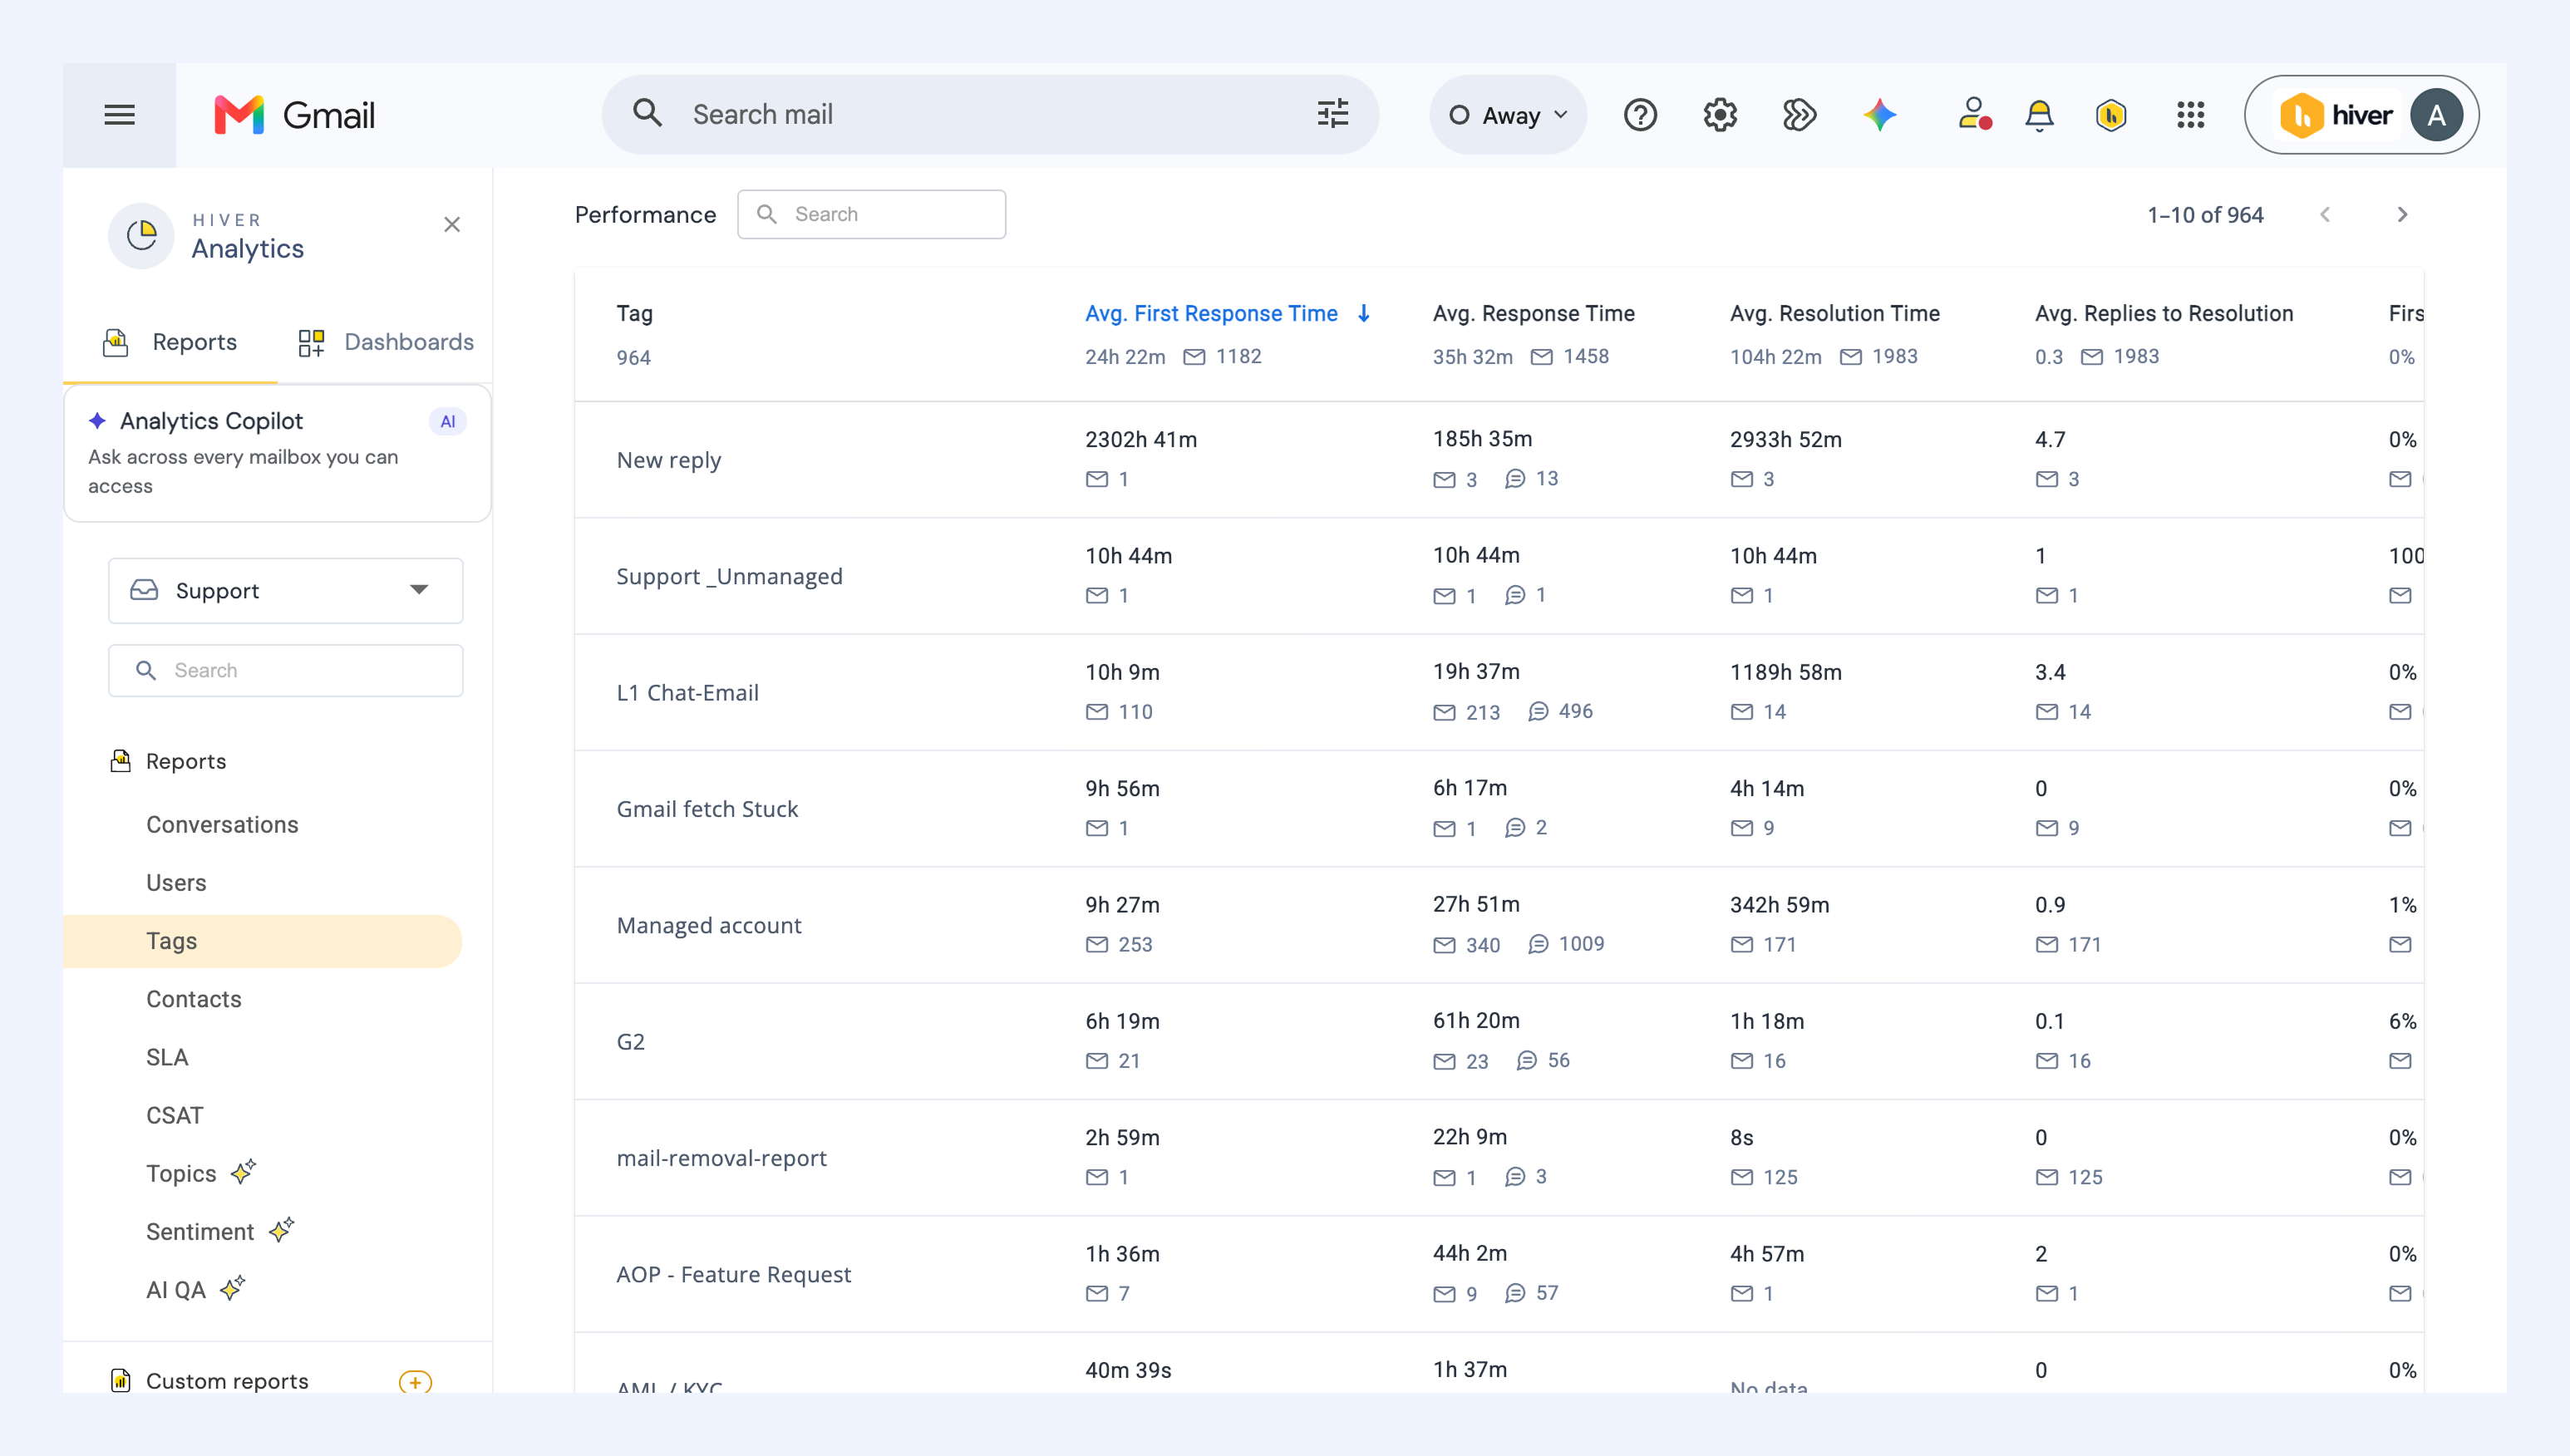
The Performance section shows how tagged conversations were handled during the selected reporting period. The first row provides an overall average across all tags.
You’ll find six metrics:
- Average first response time: The time taken to send the first reply in tagged conversations.
- Average response time: The average time it takes to reply to customer messages in related conversations.
- Average resolution time: The total time it takes to close conversations associated with the tag.
- Average replies to resolution: The average number of replies sent before conversations with the tag are resolved.
- First contact resolution: The share of resolved conversations with the tag that were closed with a single reply, shown as a count and a percentage.
- CSAT: The percentage of customer satisfaction ratings received for tagged conversations.
Analyze the report
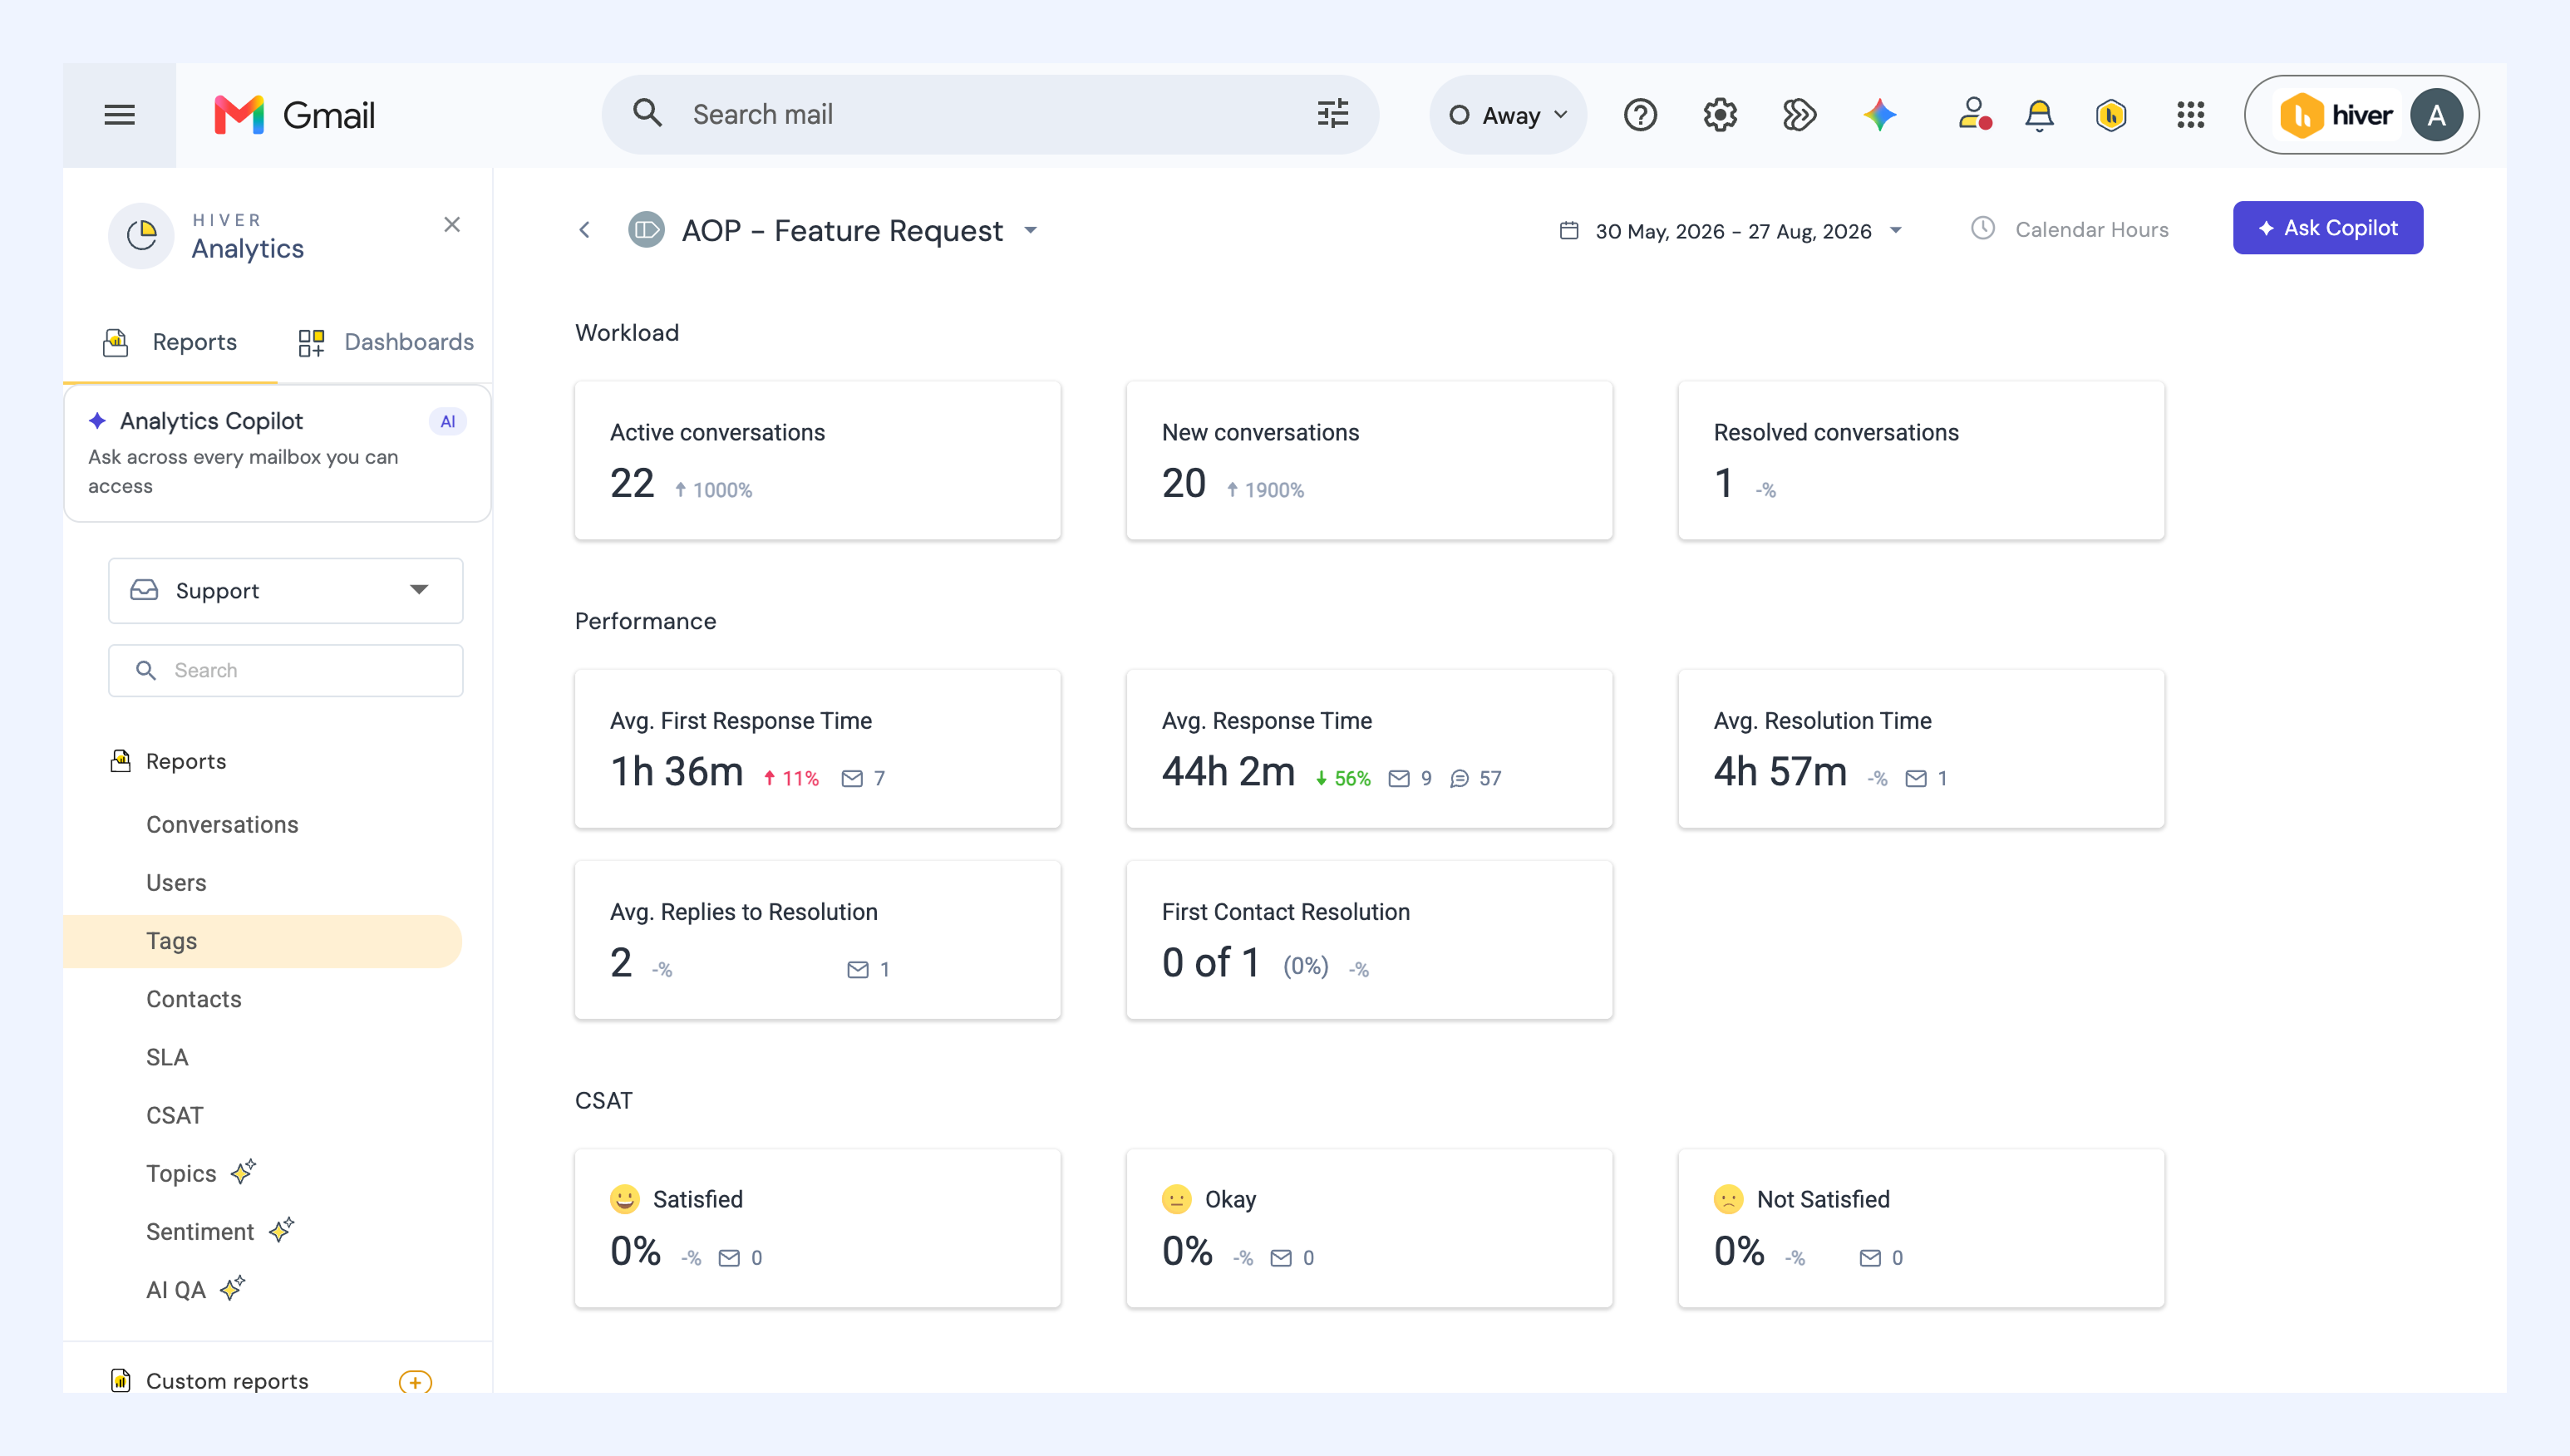
Click a tag in either the Workload or Performance table to open a detailed view that includes the following three sections:
- Workload: Number of active, new, and resolved conversations with that tag.
- Performance: Average first response, response, and resolution times, average replies to resolution, and first contact resolution.
- CSAT: Percentage and comments for satisfaction ratings received on conversations with the tag.
Explore associated conversations
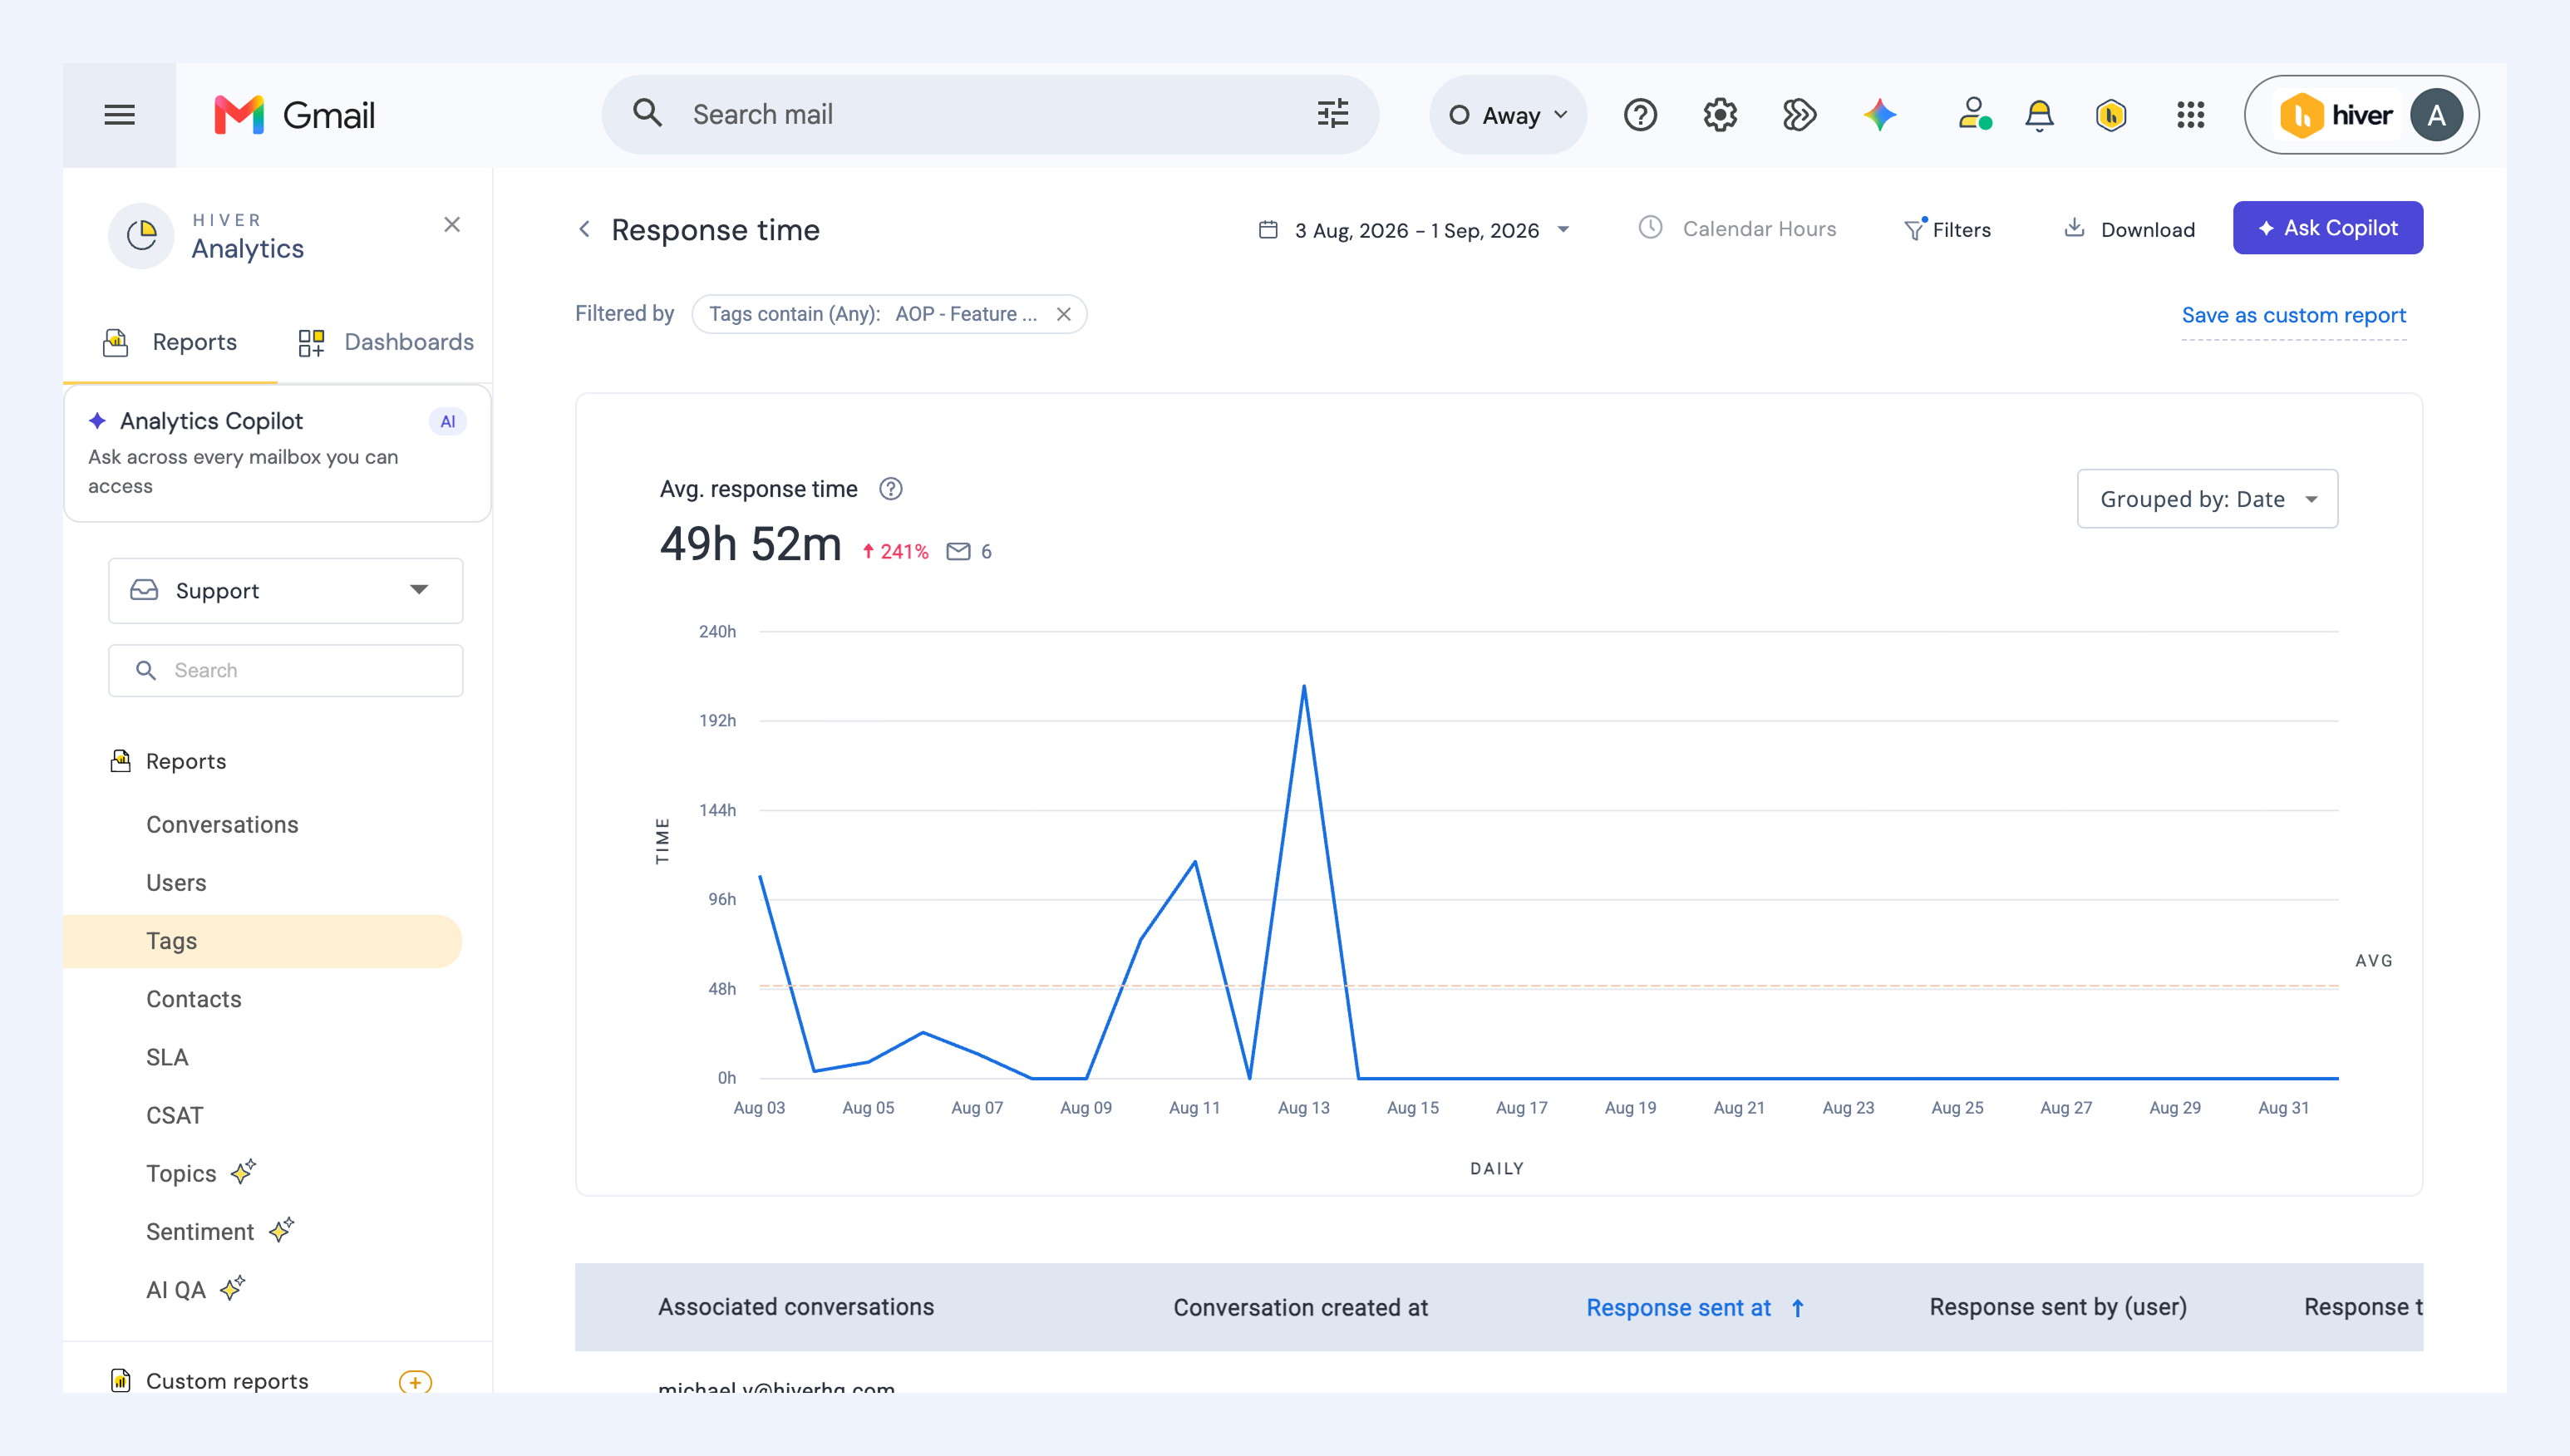
Click any metric (for example, Average response time or CSAT) to see the conversations contributing to it, along with details like created at date, assignee, and status.
This view helps you understand the real conversations behind each metric, so you can pinpoint what’s working well and what needs improvement.